


Welcome to another monthly dividend stock pick post! Here I will explain my screening process for finding high-quality dividend stocks. I will highlight which stocks are currently in my portfolio as well as my favorite picks this month that I will be looking to add. Please keep in mind, all suggestions or chart interpretations are all my opinion, I always high advise you do your own research and make sure you understand a company before you invest in it.
Now let’s dive into the stock screening criteria and our picks for this month (or scroll down to see the picks if you’re already familiar with the screen)!
Stock Screening Criteria
My stock screening criteria contains a mix of hard stats combined with a few fundamental ratios that I use as rules of thumb in order to identify stocks that reliably pay increasing dividends while also identifying if the stocks are undervalued and poised for growth. My criteria gave me a list of 19 stocks which I narrowed down to 3 based on the attractiveness of the chart and my general comfort with understanding the company.
Market Capitalization
Market Capitalization, also called market cap, shows us how much a company is worth as determined by the stock market. A company’s market cap is equal to the total value of a company’s outstanding shares of stock. For example, if a company has a total of 1 million shares selling for $10 each, that company’s market cap would be 10 million.
I screen for companies with a market cap of at least 10 billion. These are generally called large-cap companies. These companies are large, established, are the most common stocks to pay dividends, and are not generally at risk of going under any time soon. For a dividend portfolio, large cap stocks will be our bread and butter. These companies do not usually bring in huge gains in the short term, but in the long term they generally trend upward with consistent increases in share value and dividend payments, which is the name of game with a dividend portfolio.
I will do some experimenting with smaller companies; however, these monthly stock picks will be the majority of my portfolio and thus I will stick to screening for companies with a market cap of at least 10 billion.
Dividend Yield
The dividend yield is a financial ratio which shows how much a company pays out in dividends each year in relation to its stock price (annual dividends per share/price per share). For example, if a stock pays $5 per year and has a market price of $100, the dividend yield would be 5%.
As a dividend investor, you would think that the higher the yield the better because we want to maximize dividends. While that logic is correct, it is important to understand why certain stocks may have uncommonly high dividend yields. If a company has healthy finances, a high dividend yield may mean that the company is unnecessarily shelling out lots of money in the forms of dividends when it could be utilizing some of those funds instead to better position the company for long term success. Every dollar a company pays out as a dividend is a dollar the company is not using to generate capital gains. We want to see healthy balance of dividends and capital growth and sometimes a high dividend yield indicates the opposite.
A high dividend yield could also mean the stock’s price is declining while the dividend payout remains the same. The stock’s price is the denominator in the equation, so if the stock is trending downwards and the dividend payout remains the same, it will inflate the yield. Take for example a stock that paid a $1 dollar dividend per share last year with a cost of $20 dollars per share. That results in a 5% dividend yield. Imagine this year that same stock still paid $1 but now the stock was worth $10. The dividend yield would now be 10%, which is an increase from last year at the expense of the stock going down 50%.
In summary, a high dividend yield is not always bad, it just calls to our attention that we should review other metrics of the stock to confirm that the company is healthy. With all those things in mind, I screen with a dividend yield of greater than 3%. The average dividend yield of the S&P 500 is 2.22%. This screen keeps us higher than that average while also not being too high that we must worry about unhealthy dividend yields. We still may see some suspiciously high yields in our list, this just means we will dive into those stocks in more depth.
Consecutive Years of Dividend Growth
This criterion is straight forward. Past performance isn’t always a great indicator of future performance, but in the case of dividends I don’t think this mindset is overly risky. If a dividend has increased year over year for a substantial amount of time, it is fair to expect that it will continue to do so. A lot of dividend investors like to look for 10 years of growth, but I prefer to cut that short by a couple of years so that I am able to benefit earlier from the stocks that aspire to hit that mark of 10 years of increases. That is why I screen for stocks that have grown their dividends consecutively for at least 7 years.
P/E Ratio
This criterion I use as a rule of thumb and not a hard stat. P/E ratio is the price-to-earnings ratio and is calculated by market value per share divided by earnings per share. This ratio is commonly used by investors and analysts to determine if a stock is relatively undervalued and overvalued. This is where Warren Buffett found lots of success, he was great at finding companies that had discounted stock prices.
There are many complex methodologies that one can use to determine a stock’s relative value, however I believe the P/E ratio is the quickest and most straightforward way to understand a stock’s relative value. Generally, a high P/E ratio means that a stock is overvalued, and a low ratio means it is undervalued.
Seems simple enough, but there are a few limitations to keep in mind. With earnings per share as the denominator, if a stock has a very small earnings per share or none at all the P/E ratio won’t give you a true understanding of the stock’s relative value. P/E ratios also vary greatly from industry to industry. Therefore, it is helpful to view a stocks P/E ratio year over year to see how it is trending relative to stock price. It is also helpful to understand the P/E ratio of the market or the industry a certain stock is in. This information can give you context clues to determine if a stocks P/E ratio is healthy or not.
The S&P 500 has averaged a P/E ratio of 15.95 since its inception. With the above information in mind, I like to look for P/E ratios that range from 15-30, but sometimes exceptions will be made for stocks that require further research.
D/E Ratio (TTM)
The debt-to-equity ratio compares a company’s total liabilities to its shareholder equity which lets us know how much leverage they are using. It measures how much debt versus equity they are using to finance their operations. In general, a high D/E ratio means higher leverage which means the company is aggressively financing its growth with debt which is risky.
If a lot of debt is used to finance the business, the cost of that debt could outweigh the benefits of the increase in earnings that it produces, however the opposite can also be true in some cases. Cost of debt can vary with market conditions and D/E ratios can vary greatly depending on industry, so it’s not always clear if a company is over leveraged or not.
In general, a high D/E ratio usually means more risk, especially to stocks that pay dividends. If a company is needing to pay down its debts, it has less cash on hand to pay dividends. My general rule of thumb for D/E trailing 12 month average is less than 15. Best case scenario, the D/E is less than 2, but some stocks will be in industries that are capital intensive which generally require more debt, so I will not immediately remove a stock from this list if they have a high D/E, these stocks will just require further research.
November Picks


Above is a table of the stocks, their data that meets my screening criteria, plus some other information that is beneficial for evaluating dividend strength and good times to buy. LMT is highlighted yellow because that is one stock that I already have in the portfolio. Next let’s look at each stock.
Cardinal Health (CAH)
Cardinal Health, Inc. is a healthcare services and products company, which engages in the provision of customized solutions for hospitals, healthcare systems, pharmacies, ambulatory surgery centers, clinical laboratories, and physician offices. It also provides medical products and pharmaceuticals and cost-effective solutions that enhance supply chain efficiency. Cardinal Health was founded in 1971 and is headquartered in Dublin, OH. CAH has a good dividend yield, P/E, D/E and history of continued to grow their dividends.
Cardinal’s chart looks promising. CAH has been in a downtrend for the last three months but is looking like it is going to bounce a second time at this $47.80 level which was the start of CAH’s big run at the start of the year. If it bounces off of this level and then breaks through the down trend, we could see prices return to the +$52 area. However, keep in mind, it is always risky to play around with prices near 52-week lows, which is where CAH is. If it breaks down it will break down hard. So watch for confirmation of bounce.


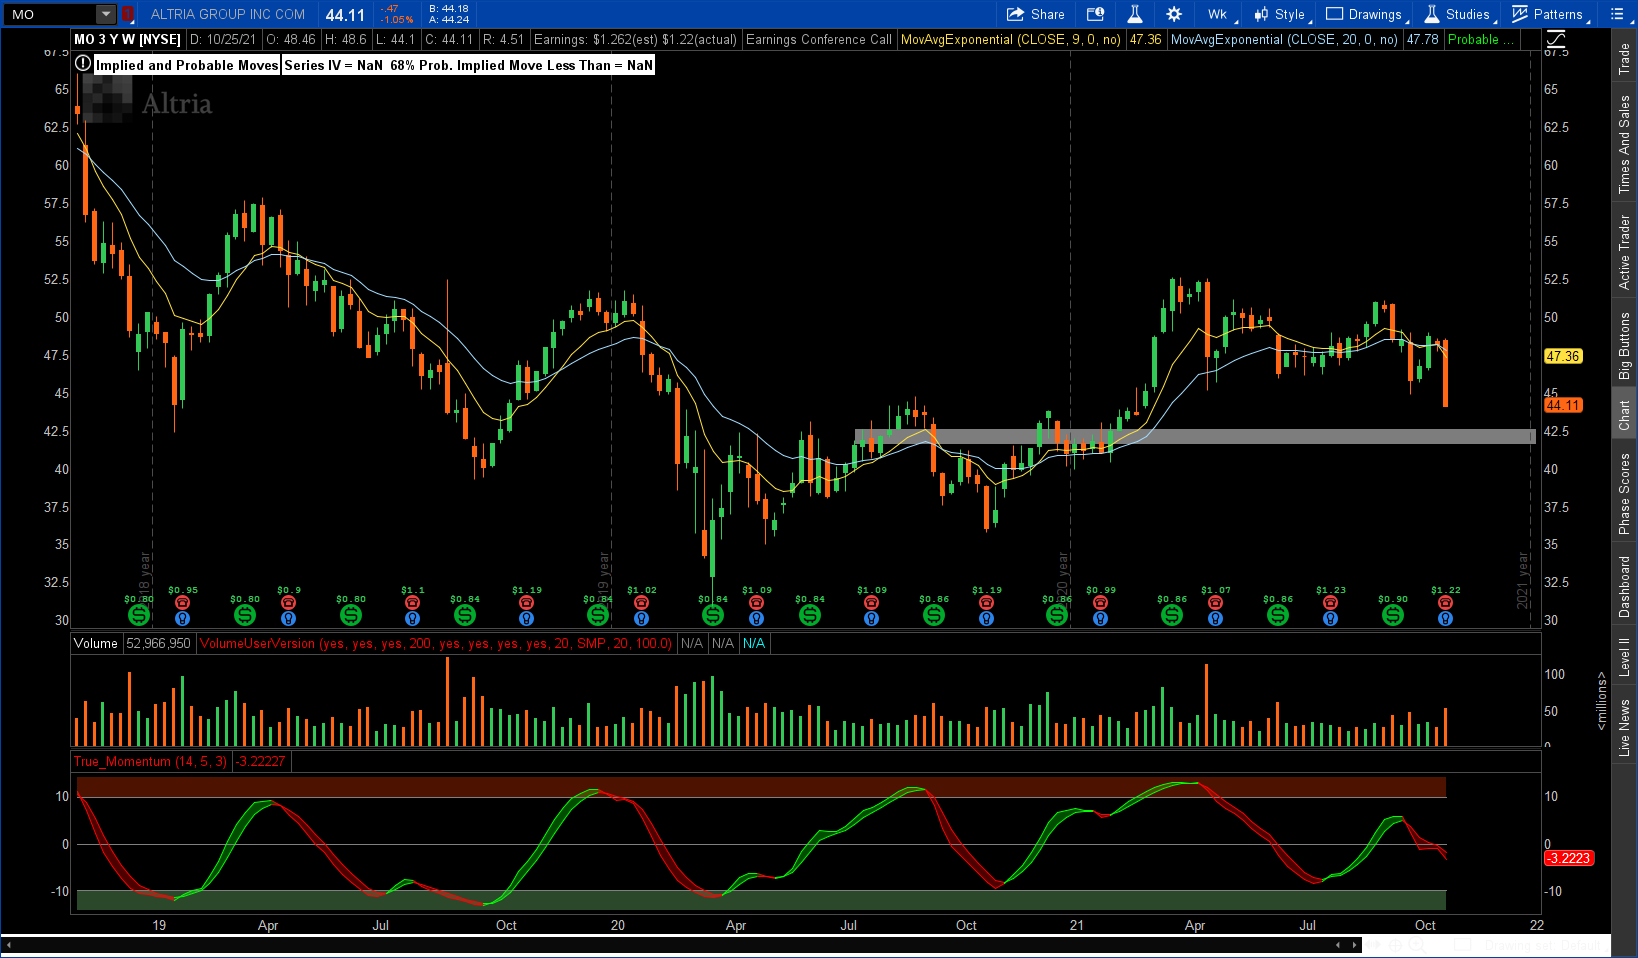
Altria (MO)
Altria Group, Inc. operates as a holding company, which engages in the manufacture and sale of cigarettes in the United States. They have smokeable and smokeless product segments. Between the two segments, they produce just about any tobacco product you can think of. They also own a wine segment. I personally have qualms with supporting the tobacco market, however, I don’t have any qualms with profiting off of it. The tobacco industry is seeing the global number of users has been rising and expect it to continue. over the next decade. MO has a good dividend yield, P/E, and D/E ratios. Their payout ratio is fairly large; however tobacco products can be lumped into the consumer staples category and the payout ratio for that industry tends to run high. It is a stable and consistent industry.
MO’s chart took a hit last week with their recent earnings report, going down nearly 10%. Great opportunity for us to grab some cheap shares! I do see that the chart could go back to previous resistance turned support levels around the $42 area. With reactions to earnings being so volatile, it would be good to wait for more downside before entering. If it bounces early, great, I’ll buy! If it keeps going down, I’ll keep watching for a bounce to get in at.
Lockheed Martin (LMT)
Lockheed Martin Corp., founded in 1961 and headquartered in Bethesda, MD, operates as a global security and aerospace company, which engages in the research, design, development, manufacture, integration, and sustainment of technology systems, products, and services. Their defense business has a great backlog of guaranteed work and their expansion into the space realm is very enticing. I think LMT has a great long term future.
Like Altria, they had an earnings report last week that knocked the stock down from $377 all the way down to $325. In last week’s portfolio update, I wrote a paragraph reviewing the report, read that article here. Unlike Altria, however, LMT has already bounced and established a bottom on this knife. I caught a share last week at $327. I’ll keep watching how this plays out by chance I want to add some more. If this bounce proves to be significant, I see potential upside towards the $332 area. If not and this support level at $330 breaks, then there is potential downside to the 52 week low at $320. I feel good about the bounce, but if you don’t, it is always good to wait for a better confirmation as selling strength is still evident in these candles.

Conclusion
In this article, I screened for stocks that look like they will provide regular growing dividends while also having potential for capital gains. My screening criteria found 22 stocks which fit the mold, I then narrowed that list down to 3 based off of the attractiveness of the stock’s chart and my comfort with understanding the company.
I am long on all the stocks on this list. Of the picks, I already have a position in LMT. I will watch this list play out through the month and will either open new positions or add to current positions at key levels if my capital allows.
I do also take into account what months these stocks pay their dividends and I try to balance my portfolio so that I am earning roughly the same amount of dividends every month. This goal may influence my timing and decisioning when it comes to purchasing some of the stocks on this list.
All 3 stocks are suitable for further research and my article is not to be taken as financial advice. Thank you for reading and feel free to leave any replies or questions you may have on here or on my socials.
3 replies on “November Dividend Stock Picks”
[…] this so that I can take advantage of good buying opportunities which are usually called out in my monthly stock picks or other timely articles. Stock picks for this month are LMT, CAH, and MO. I own positions in two […]
[…] opportunities which are usually called out in my monthly stock picks or other timely articles. Stock picks for this month are LMT, CAH, and MO. As of this week I now have positions in all of the stock picks and they are performing fairly […]
[…] Last month we screened for strong dividend paying stocks that are poised for growth and narrowed it down to 3 picks. I added to positions last month in all three positions. Here we will review how those stocks did in the month of October and how good our screener and our charting analysis was. Click here to read that article. […]