Welcome to another monthly dividend stock pick post and welcome to the new year! Here I will explain my screening process for finding high-quality dividend stocks and using my charting and company analysis to determine if these stocks are a good buy this month. Please keep in mind, all suggestions or chart interpretations are all my opinion, I always highly advise you do your own research and make sure you understand a company before you invest in it.
Now let’s dive into the stock screening criteria and our picks for this month!
Stock Screening Criteria
My stock screening criteria contains a mix of hard stats combined with a few fundamental ratios that I use as rules of thumb in order to identify stocks that reliably pay increasing dividends while also identifying if the stocks are undervalued and poised for growth.
My criteria gave me a list of 25 stocks which I narrowed down to 2. As Warren Buffett once said, “Never invest in a company you don’t understand.” I adhere to this rule and take stocks out of my watchlist based on my comfortability with understanding the company and the attractiveness of their chart. Below are the criteria and why I use them.
Market Capitalization
Market Capitalization, also called market cap, shows us how much a company is worth as determined by the stock market. A company’s market cap is equal to the total value of a company’s outstanding shares of stock. For example, if a company has a total of 1 million shares selling for $10 each, that company’s market cap would be 10 million.
I screen for companies with a market cap of at least 10 billion. These are generally called large-cap companies. These companies are large, established, are the most common stocks to pay dividends, and are not generally at risk of going under any time soon. For a dividend portfolio, large cap stocks will be our bread and butter. These companies do not usually bring in huge gains in the short term, but in the long term they generally trend upward with consistent increases in share value and dividend payments, which is the name of game with a dividend portfolio.
I will do some experimenting with smaller companies; however, these monthly stock picks will be the majority of my portfolio and thus I will stick to screening for companies with a market cap of at least 10 billion.
Dividend Yield
The dividend yield is a financial ratio which shows how much a company pays out in dividends each year in relation to its stock price (annual dividends per share/price per share). For example, if a stock pays $5 per year and has a market price of $100, the dividend yield would be 5%.
As a dividend investor, you would think that the higher the yield the better because we want to maximize dividends. While that logic is correct, it is important to understand why certain stocks may have uncommonly high dividend yields. If a company has healthy finances, a high dividend yield may mean that the company is unnecessarily shelling out lots of money in the forms of dividends when it could be utilizing some of those funds instead to better position the company for long term success. Every dollar a company pays out as a dividend is a dollar the company is not using to generate capital gains. We want to see a healthy balance of dividends and capital growth and sometimes a high dividend yield indicates the opposite.
A high dividend yield could also mean the stock’s price is declining while the dividend payout remains the same. The stock’s price is the denominator in the equation, so if the stock is trending downwards and the dividend payout remains the same, it will inflate the yield. Take for example a stock that paid a $1 dollar dividend per share last year with a cost of $20 dollars per share. That results in a 5% dividend yield. Imagine this year that same stock still paid $1 but now the stock was worth $10. The dividend yield would now be 10%, which is an increase from last year at the expense of the stock going down 50%.
In summary, a high dividend yield is not always bad, it just calls to our attention that we should review other metrics of the stock to confirm that the company is healthy. With all those things in mind, I screen with a dividend yield of greater than 2.5%. The average dividend yield of the S&P 500 is 2.22%. This keeps us right at the average. We still may see some suspiciously high yields in our list, this just means we will dive into those stocks in more depth to understand why. We may also see some lower yields, but those low yields should be justified by strong dividend growth. In the long run, a mix of high yield and low yield/high growth dividend stocks will be good for our portfolio.
Consecutive Years of Dividend Growth
This criterion is straight forward. Past performance isn’t always a great indicator of future performance, but in the case of dividends I don’t think this mindset is overly risky. If a dividend has increased year over year for a substantial amount of time, it is fair to expect that it will continue to do so. That is why I screen for stocks that have grown their dividends consecutively for at least 7 years. Lots of companies pride themselves on attaining the status of a “Dividend King” or a “Dividend Aristocrat” as it is quite the impressive title and it attracts dividend investors which is good for the stock’s price in the long term. By screening for at least 7 years of consecutive increases we, at the least, may be able to find companies that are on their way to attaining those titles (if they aren’t achieved already) and we can benefit from their efforts to do so.
P/E Ratio
This criterion I use as a rule of thumb and not a hard stat. P/E ratio is the price-to-earnings ratio and is calculated by market value per share divided by earnings per share. This ratio is commonly used by investors and analysts to determine if a stock is relatively undervalued and overvalued. This is where Warren Buffett found lots of success, he was great at finding companies that had discounted stock prices.
There are many complex methodologies that one can use to determine a stock’s relative value, however I believe the P/E ratio is the quickest and most straightforward way to understand a stock’s relative value. Generally, a high P/E ratio means that a stock is overvalued, and a low ratio means it is undervalued.
Seems simple enough, but there are a few limitations to keep in mind. With earnings per share as the denominator, if a stock has a very small earnings per share or none at all the P/E ratio won’t give you a true understanding of the stock’s relative value. P/E ratios also vary greatly from industry to industry. Therefore, it is helpful to view a stocks P/E ratio year over year to see how it is trending relative to stock price. It is also helpful to understand the P/E ratio of the market or the industry a certain stock is in. This information can give you context clues to determine if a stocks P/E ratio is healthy or not.
The S&P 500 has averaged a P/E ratio of 15.95 since its inception. With the above information in mind, I like to look for P/E ratios that range from 15-30, but sometimes exceptions will be made for stocks that require further research.
D/E Ratio
The debt-to-equity ratio compares a company’s total liabilities to its shareholder equity which lets us know how much leverage they are using. It measures how much debt versus equity they are using to finance their operations. In general, a high D/E ratio means higher leverage which means the company is aggressively financing its growth with debt which is risky.
If a lot of debt is used to finance the business, the cost of that debt could outweigh the benefits of the increase in earnings that it produces, however the opposite can also be true in some cases. Cost of debt can vary with market conditions and D/E ratios can vary greatly depending on industry, so it’s not always clear if a company is over leveraged or not.
In general, a high D/E ratio usually means more risk, especially to stocks that pay dividends. If a company is needing to pay down its debts, it has less cash on hand to pay dividends. My general rule of thumb for D/E trailing 12 month average is less than 15. Best case scenario, the D/E is less than 2, but some stocks will be in industries that are capital intensive which generally require more debt, so I will not immediately remove a stock from this list if they have a high D/E, these stocks will just require further research.
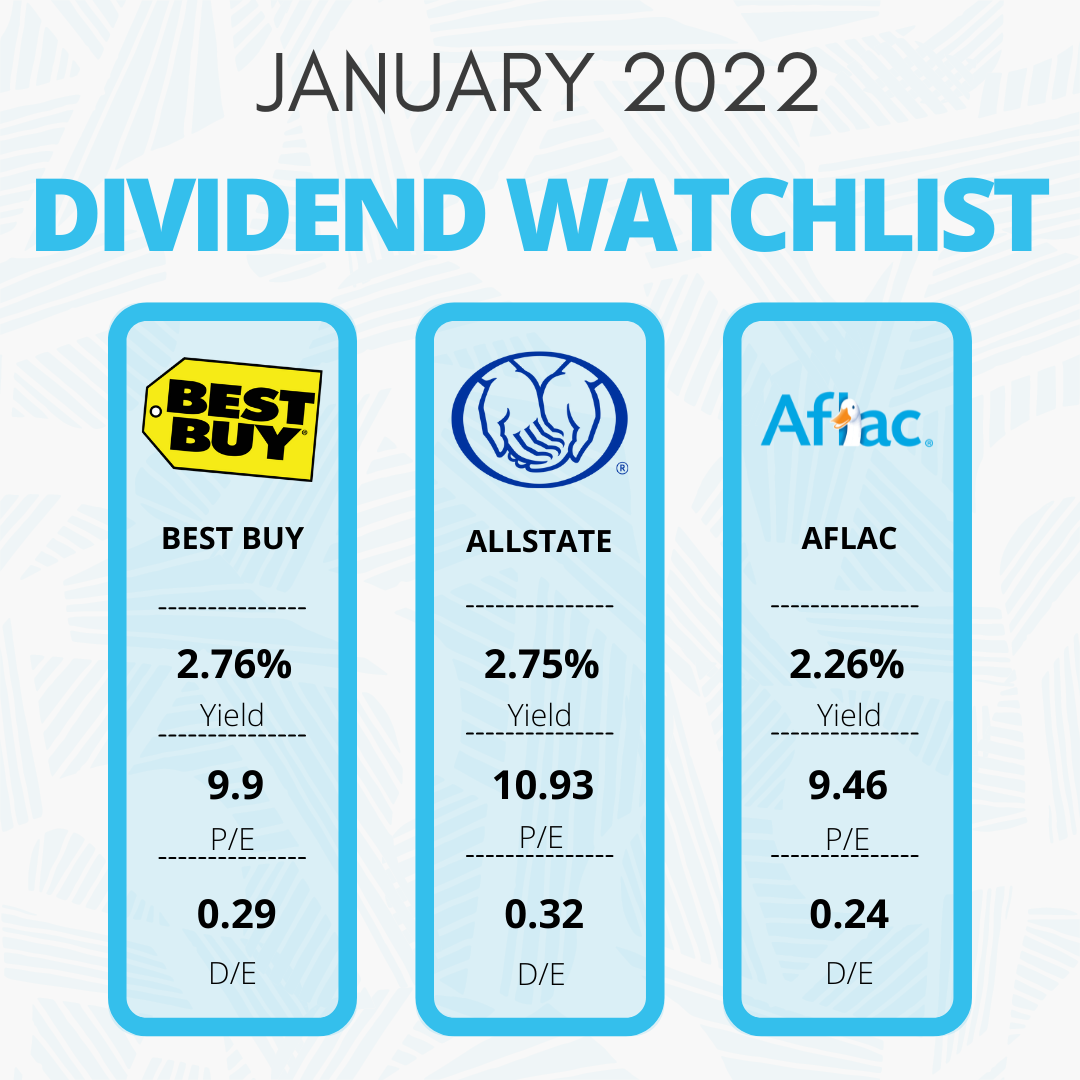
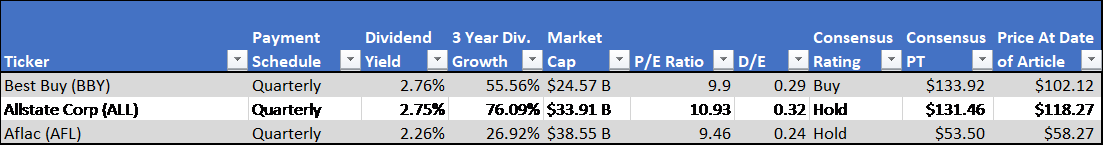
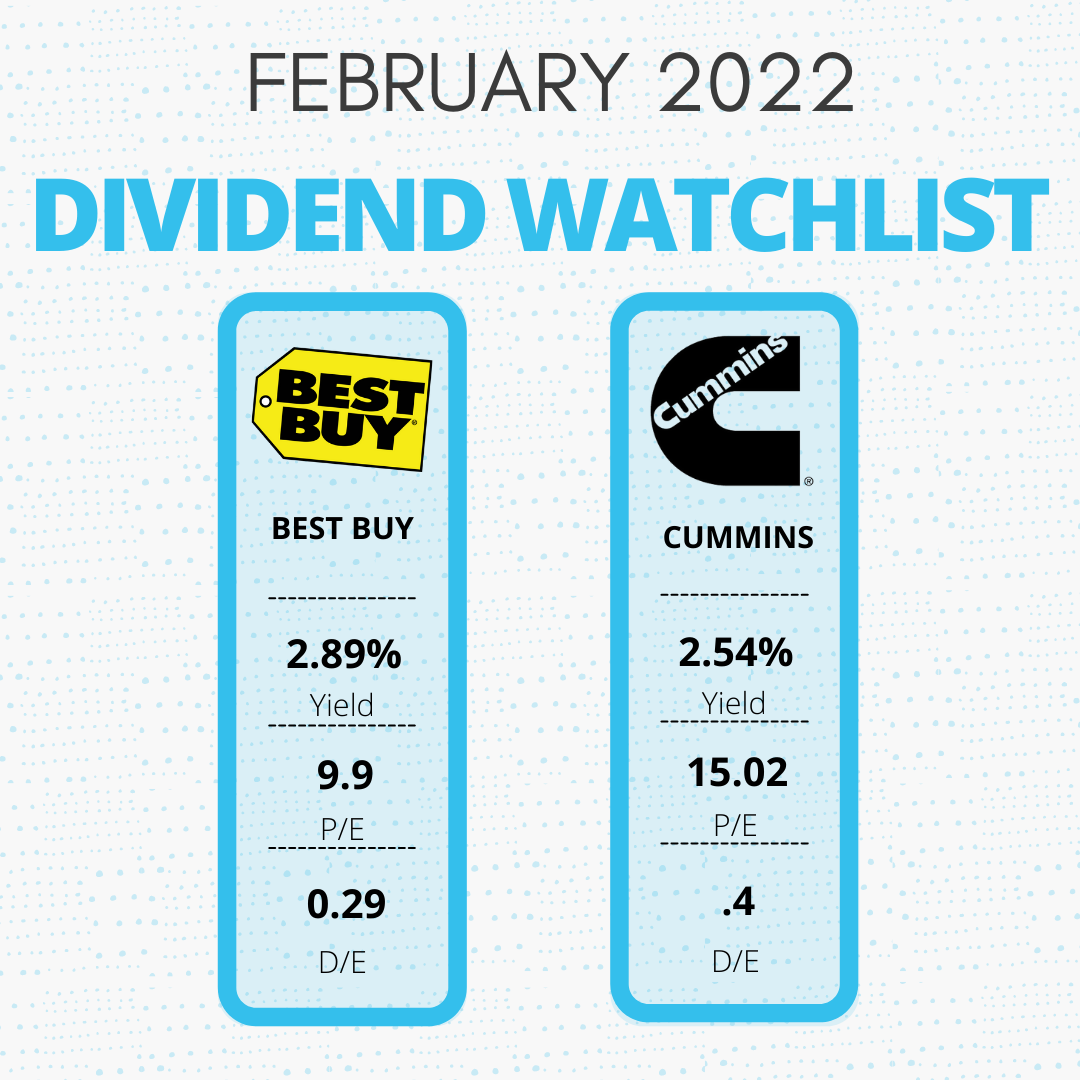
February Picks

Above is a table of the stocks, their data that meets my screening criteria, plus some other information that is beneficial for evaluating dividend strength and good times to buy. Next, we will look at each stock, go over a little bit about the company, and discuss their chart.
Best Buy Co. (BBY)
Best Buy Co. retails technology products in the United States and Canada. They provide computing, mobile phones, and many other consumer electronics and appliances. In addition, Best Buy also provides consultation, delivery, design, installation, memberships, protection plans, repair, set-up, and other technical support services. As of January 30th, 2021, Best Buy had 1,126 large-format at 33 small-format stores. The only concerning thing I saw about was their PE ratio of 9.9. This number is a little bit below my criteria, however, given the industry average of 11.96, their PE ratio is not bad.
Best Buy is a carry-over pick from last month. Their chart looks promising but didn’t give us the move I was expecting. It’s at a lower price now giving us a better opportunity to add.
Best Buy’s price action has bounced for the now the FOURTH time off of the channel support line at the $95 area. Last month it touched that area and bounced up, but didn’t have much steam to push higher off of the bounce. No material news had come within the last month, I believe the performance was simply muted due to the market movement we experienced in the last month. The first bounce happened in December of 2020 and quickly moved up to the $115 area. I am hoping for a similar move. Now that the last bounce proved to be weak, price action has stayed flat on the bottom bound of the channel and has stayed on it with some consistency. The longer it stays at this level, the stronger I believe a coming up trend will be. However, if we break this level, BBY will have a new 52 week low that could push us to the $88 support level and below. Watch for breaks at the $95 level, if the break is weak I plan on adding more, if the break is strong I will sit back and watch it play out.

Cummins (CMI)
Cummins designs, manufactures, distributes, and services diesel and natural gas engines, electric and hybrid powertrains, and related components worldwide. It operates through five segments: Engine, Distribution, Components, Power Systems, and New Power. The company offers diesel and natural gas powered engines under the Cummins and other customer brands for the heavy and medium-duty truck, bus, recreational vehicle, light-duty automotive, construction, mining, marine, rail, oil and gas, defense, and agricultural markets; and offers new parts and services, as well as remanufactured parts and engines. It also provides power generation systems, high-horsepower engines, heavy and medium duty engines, application engineering services, custom-designed assemblies, retail and wholesale aftermarket parts, and in-shop and field-based repair services. The company also offers emission solutions; turbochargers; air and fuel filters, fuel water separators, lube and hydraulic filters, coolants, fuel additives, and other filtration systems; and electronic control modules, sensors, and supporting software, as well as new, replacement, and remanufactured fuel systems. The company sells its products to original equipment manufacturers, distributors, dealers, and other customers. Cummins was founded in 1919 and is a proven high-quality operator that is beginning to look attractive given the cyclicality of the business.
CMI’s chart looks like a wedge that also has an established support area around $220. The price first bounced off of $220 in last September and then broke under it in November. That support then turned into resistance which price action failed to break twice towards the end of 2021. Finally, towards the start of this year, the price broke through $220, making that area a support level again. Price has sat on that support level since and looks to be pushed upwards due to the narrowing of the wedge. I expect to see prices jump up and down around the $225 area before the wedge breaks. If it breaks up, we can see a strong move upwards. To me, I will be looking for buys on quick dips below $225 and $220.

Conclusion
In this article, I screened for stocks that look like they will provide regular growing dividends while also having potential for capital gains. My screening criteria found 25 stocks which fit the mold, I then narrowed that list down to 2 based on the attractiveness of the stock’s chart and my comfort with understanding the company.
I will watch these stocks play out through the month and add to them as opportunities present themselves, these chart analyses help us to be prepared for those buying opportunities. These stocks are suitable for further research and my article is not to be taken as financial advice. Thank you for reading and feel free to leave any replies or questions you may have on here or on my socials.