Categories
Due Diligence Economics Market Outlook Market Recap Market Update Stock Market

Stock Market Recap & Outlook (6/16/23) – Another Upbeat Week

This weekly market recap is brought to you by Koyfin, a powerful analytical tool that I am proud to partner with. Their platform is entirely customizable for whatever data you want to look at including stocks, ETFs, mutual funds, currencies, economic data releases (one of my personal favorites used often for these posts), crypto, and even transcripts of company events! Click the link above to get a special offer only for Dividend Dollar readers or go give my product review a read if you’re interested!

Dividend Dollars’ Outlook & Opinion

Last week we called for more bullishness, under the caveat that CPI and the Fed do what we expect. And they did not disappoint. I wanted to see the S&P 500 close above 4,340 and it did by a fair margin. Funny enough, Monday’s high touched my level and then gapped well above it at the open on Tuesday. It came back down to test it on Wednesday and it proved to be a solid support line.

Despite Friday’s choppiness, this was one of the best weeks for the market in some time. 52 week highs were being handed out like goodie bags at an Oprah show with $AAPL, $AI, $DAL, $META, $NFLX, $WMT, $UBER, $NVDA, $MSFT, $ORCL, and many others hitting yearly highs.

The hawkish language that was dolled out by the FOMC on Wednesday didn’t seem to scare investors much. I don’t know if it’s a belief that corporate earnings and the general economy will be able to handle a few more hikes, or if they’re calling the bluff on the Fed’s hawkishness. Only time will tell, but the disbelief was obvious this week. Are stocks suggesting the worst is behind us or are there too many of us with FOMO buying up equities right now?

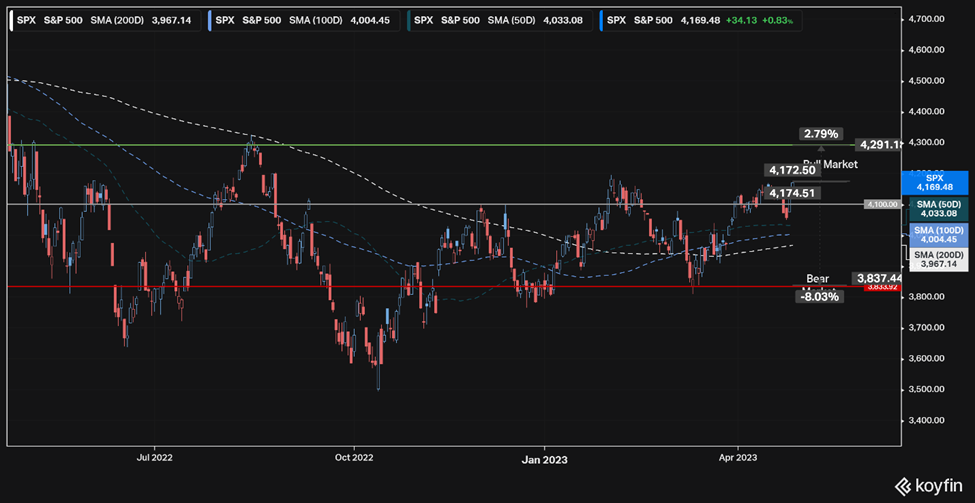
Technical-wise, the S&P 500 is continuing its streak of new 52-week highs as resistance levels seem feeble. After breaking through the firm resistance at 4,200, there has not been much standing in the way of the bulls. However, the market is running very hot with a high RSI reading of just under 77 on Thursday. The last time the RSI read higher than 77 was back in September of 2021 when it hit 82. After that RSI peak, the market experienced a 10% correction over the next three weeks. Could history repeat itself? Usually it does, but the timing is the tricky part. I am loath to call a correction, but I am trying to give you a sense of when one could over the horizon.

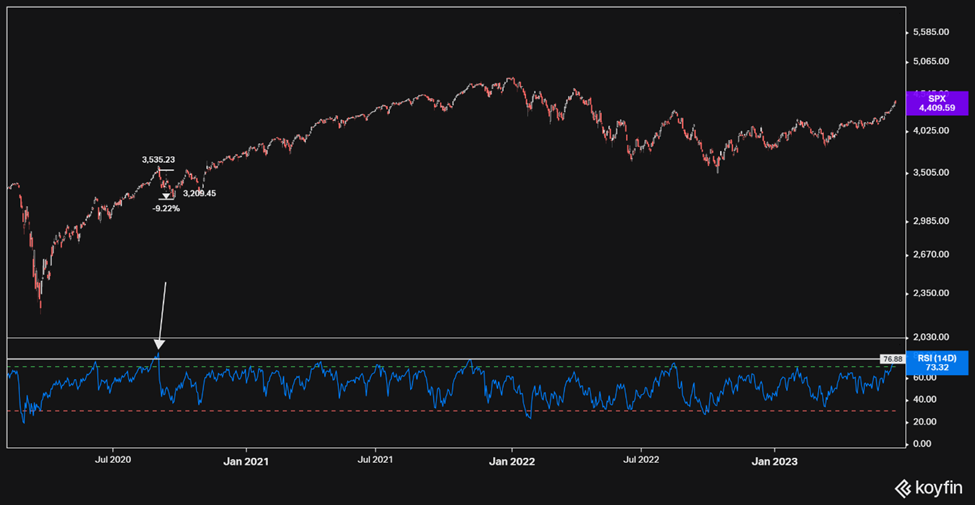
However, RSI aside, the chart still looks quite bullish to me. We have a little area of resistance that was generated by some slight consolidation last April, this is noted in the light red channel in the chart below. We absolutely plowed through the 0.618 level (4,312) of the Fibonacci retracement produced from the high of January 2022 to the low of October 2022. This bit of resistance could push us back down to that level or we continue higher to the next level. The market could lose some steam, making a re-test more likely. However, except for Friday, the market’s price action is not exhibiting much weakness!

Overall, this week was heavy with economic data that mostly came in with readings that supported a market move higher. However, in the last hours of the final trading day for the week, some profit taking occurred ahead of the three-day weekend. Inflation has continued to trend down, technicals are still mostly bullish, there is a healthy amount of skepticism among investors, stocks are fully valued at a forward P/E of 19 for the S&P 500, recession risk is not out of the question yet, and we appear to be nearing a reasonable consolidation period. Lots of things to consider. Its hard to time an expected consolidation move, but one seems increasingly possible. On the other hand, I still respect the bullish momentum we’ve been seeing, even though they are starting to appear stretched. Therefore, my outlook for next week is neutral. I equally could see a move higher to the next fib level just above 4,500 or a move to test the 4,300 area. Next week is light on the economic data front as long as we don’t get a jobless claims surprise. So be ready to play either side.

Weekly Market Review

Summary:

This week another bullish one for the market as the major indices hit gains. The S&P 500 had its 5th winning week in a row and closed above 4,400. Mega-caps were leading as $AAPL and $MSFT hit new all time highs. Small and mid-caps trailed them after a big run recently. The Russell 2000 had the smallest gain among the indices for the week but shows the largest gain on the month so far.

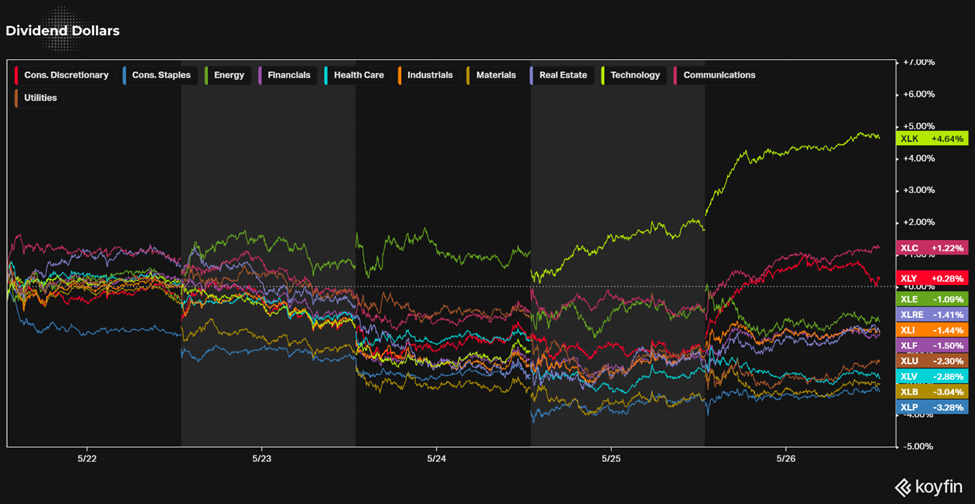
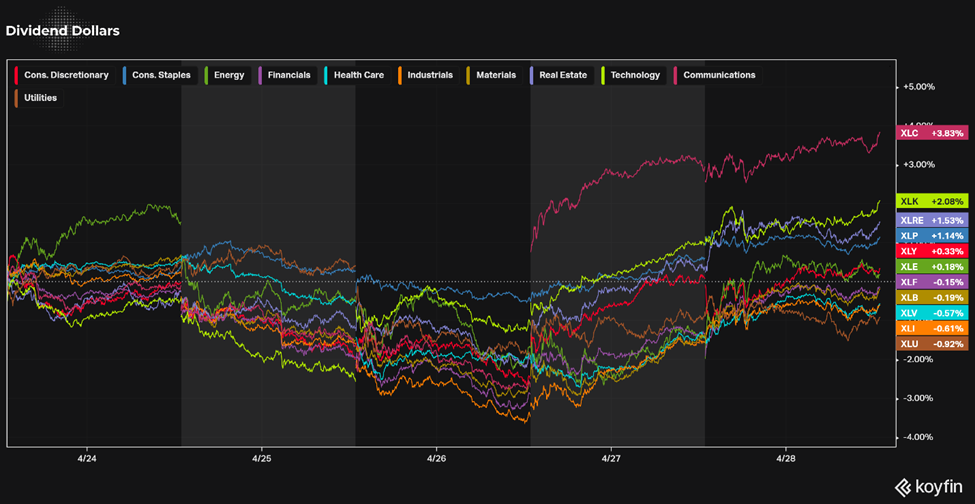
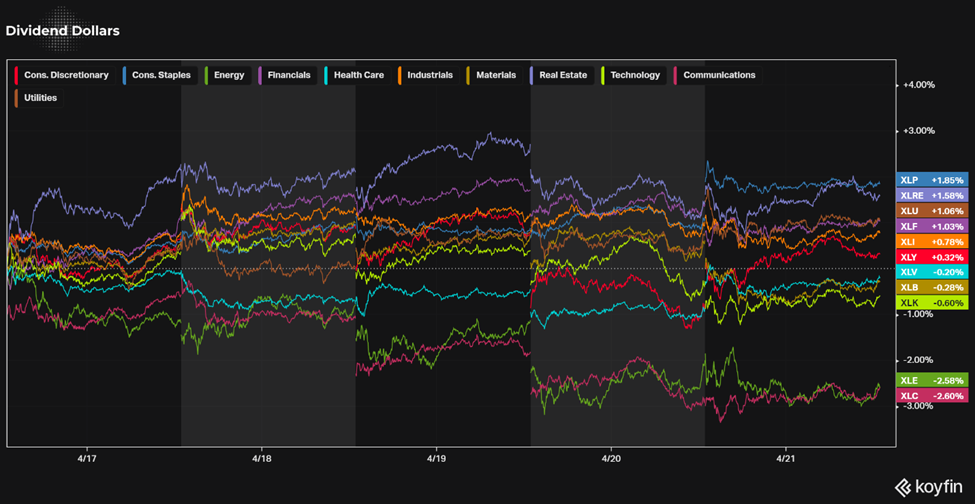
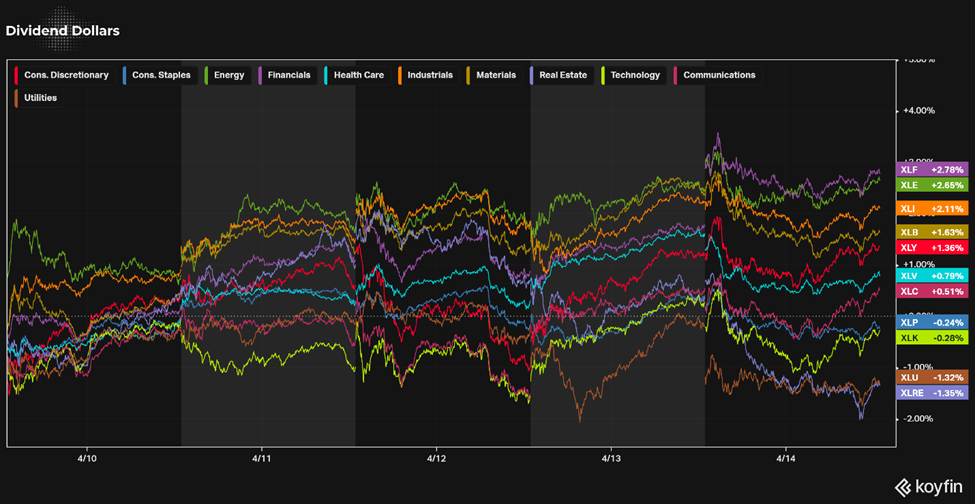
This improvement in market breadth saw the $RSP rise 2.5%. Also, all but 1 of the 11 S&P 5000 sectors made gains this week. Energy was the lone loser (-0.6%) while technology (+4.3%) and materials (+3.5%) lead.

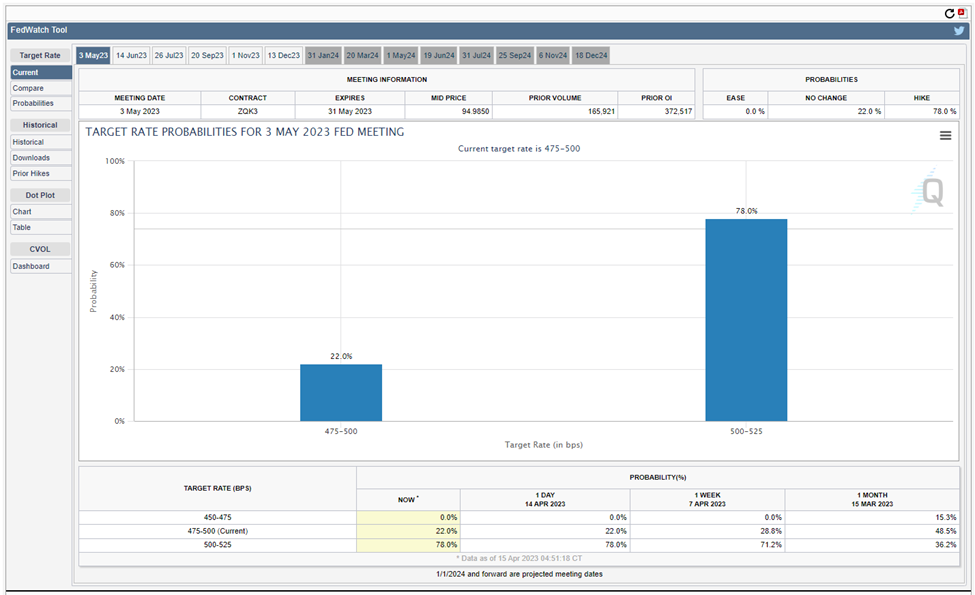
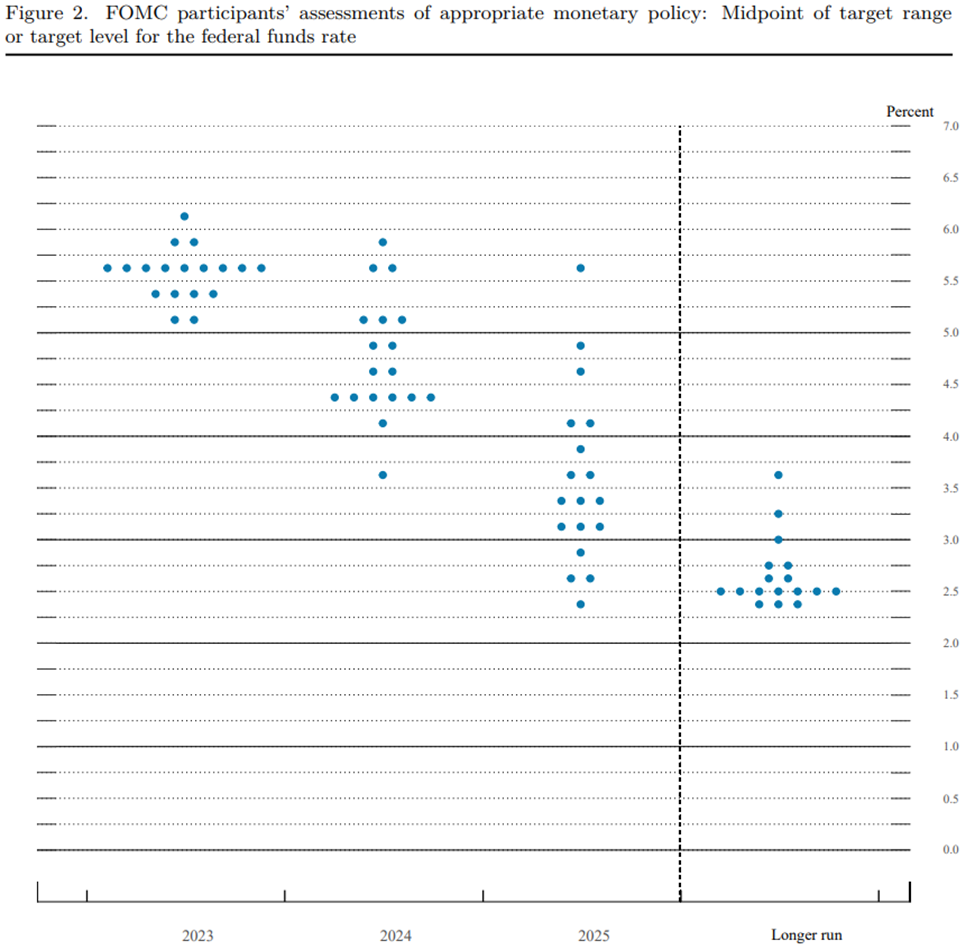
The rally for the week picked up steam as the CPI release on Tuesday, the PPI on Wednesday, and the FOMC meeting all went the market’s way in feeling better about inflation and the economy. The FOMC voted to not change the fed funds rate. The latest dot-plot shows an increase in the median projection for the rate in 2023, meaning there may be at least two more hikes this year. The forecasts for 2024 and 2025 also saw an increase, meaning we have a higher for longer policy rate outlook.

After the minutes release, Fed Powell’s press conference made no promises for the July meeting. In spite of the hawkishness of the Fed materials, the market’s response reflects a belief that the Fed may actually pull off a soft landing and get inflation back down to 2% without too much damage. The market seemed to believe that the Fed may be done, or close to done, with raising rates.

Monday:

Monday looked positive in the beginning of the day, but really started to pick up steam in the afternoon as the S&P closed at its highest level since April 2022. The stock market kicked it into gear as rates declined after the Treasury market did a good job of absorbing the $200B worth of bills and notes, with another $101B scheduled to be sold on Tuesday.

Mega-caps lead the way with many others following as $MGK was up 1.5% and $RSP was up 0.7%. The energy sector, however, failed to perform with its -1% loss. Oil prices fell -4.6% in response to Goldman Sachs cutting its Brent Crude forecast by nearly 10%, citing higher oil supplies.

Tuesday:

Tuesday’s market continued the positivity as indices closed near their best levels of the day. The CPI report released in the morning seemed to enhance the view that the Fed will not raise rates this week and lessened expectations of a hike in July.

Again, price action seemed to show a belief that the Fed may not overtighten on their path to bring inflation back down. That belief was reflected in a more pro-cyclical trade and led to a better performance in domestic small caps and value stocks than growth stocks for the day.

Economic data for the day included the NFIB Small Business Optimism Survey and the CPI report.

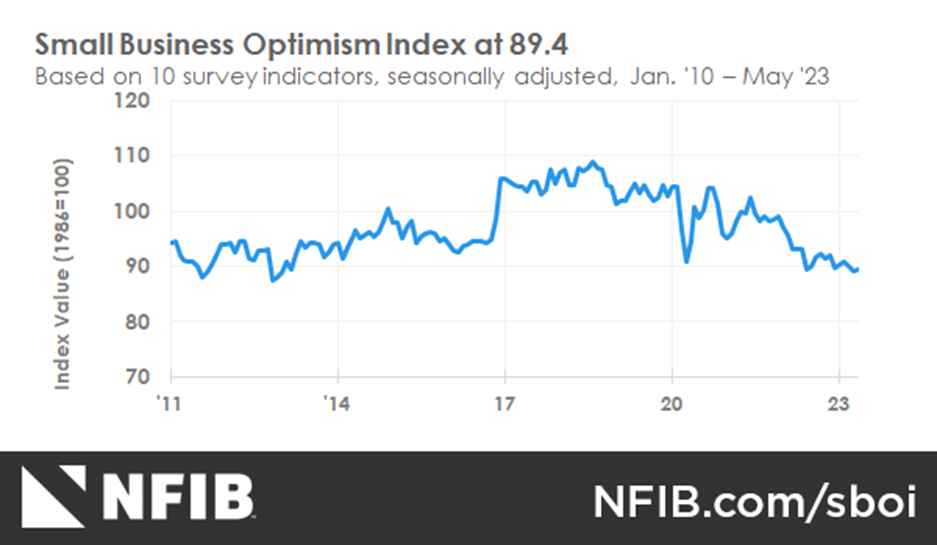
The NFIB survey rose to 89.4 up from 89.0 in April. This reading was the 17th consecutive reading below the 49-year average of 98. The survey showed that the difficulty to fill jobs is still historically high, business owners are slightly slowing with raising prices, and sales increase expectations have fallen slightly.

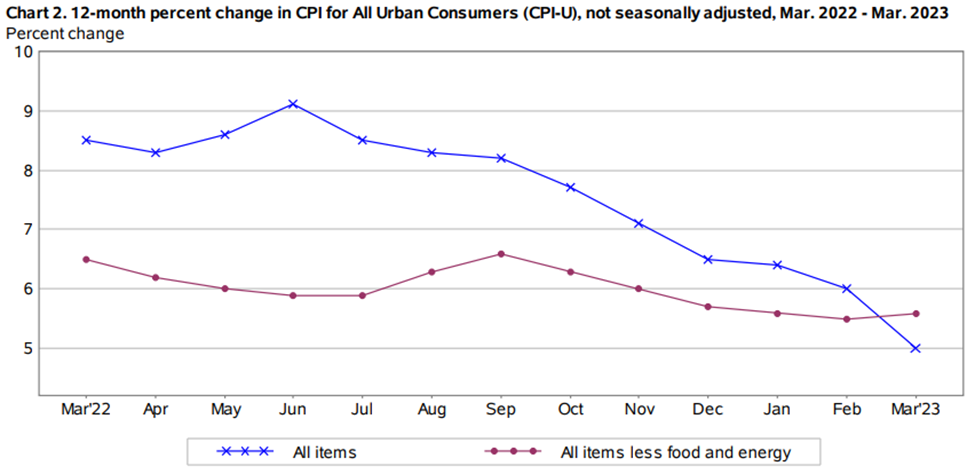
The CPI report was up 0.1% MoM, just under expectations of 0.2%. Core CPI was up 0.4% MoM, as expected. It was driven by an increase in the shelter index and the vehicle index. On a YoY basis, the CPI is up 4% versus 4.9% in April, the smallest change in the 12 months ending March 2021. The Core CPI rose 5.3% YoY, down from 5.5% last reading. The shelter index accounted for over 60% of the total increase. The key takeaway here is that inflation rates are moving in the right direction, but core inflation is still too high for the Fed’s liking which is why future rate hike prospects are still alive.

Wednesday:

The market was in a narrow range, leading up to the FOMC decision in the afternoon and the press conference that followed. They voted unanimously to keep rates, yest stocks fell a bit with the release of their projections which showed an upward adjustment in the median rate for 2023.

The market started to climb as the press conference began. Stocks recovered as Powell said the July meeting is a “live” meeting, meaning its outcome is not predetermined. There are 4 Fed meetings left, and no rate hikes are being frontloaded. The market is making some allowance for the chance that they don’t push the rate as high as the dot plot suggests.

Economic data for the day included the weekly MBA index and the PPI.

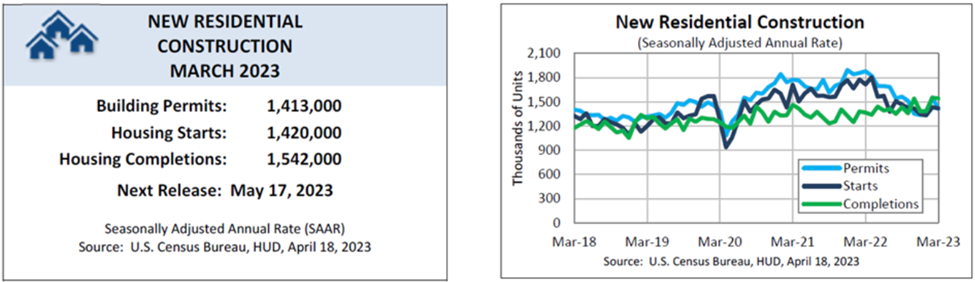
The mortgage applications index rose 7.2% with purchase applications jumping up 8% and refinancing up 6%.

The Producer Price Index reading for final demand fell 0.3% MoM, under the -0.1% consensus, while the core PPI rose 0.2% MoM as expected. YoY the index was up 1.1% versus 2.3% last month, and the core was up 2.8% versus 3.2% last month. The key here is that wholesale inflation is trending in the right direction, which should help with decreasing future rate hike probabilities and positivity for corporate margins.

Thursday:

Thursday was strong as the market rallied on a spattering of economic data releases. The indices closed near their highs of the day.

The economic data was mixed overall, but some highlights fueled the run of the day. $CAVA’s IPO also helped to boost investor sentiment after it opened at a huge premium above is $22 IPO price.

Economic data for the day included retail sales, jobless claims, the May import and export prices, and industrial production.

Total retail sales increased 0.3% MoM, above flat expectations. Spending was flat or higher in May for nearly every category with the exception of gasoline stations and miscellaneous retailers, which shows the resilient spending capacity of consumers who continue to benefit from a strong labor market.

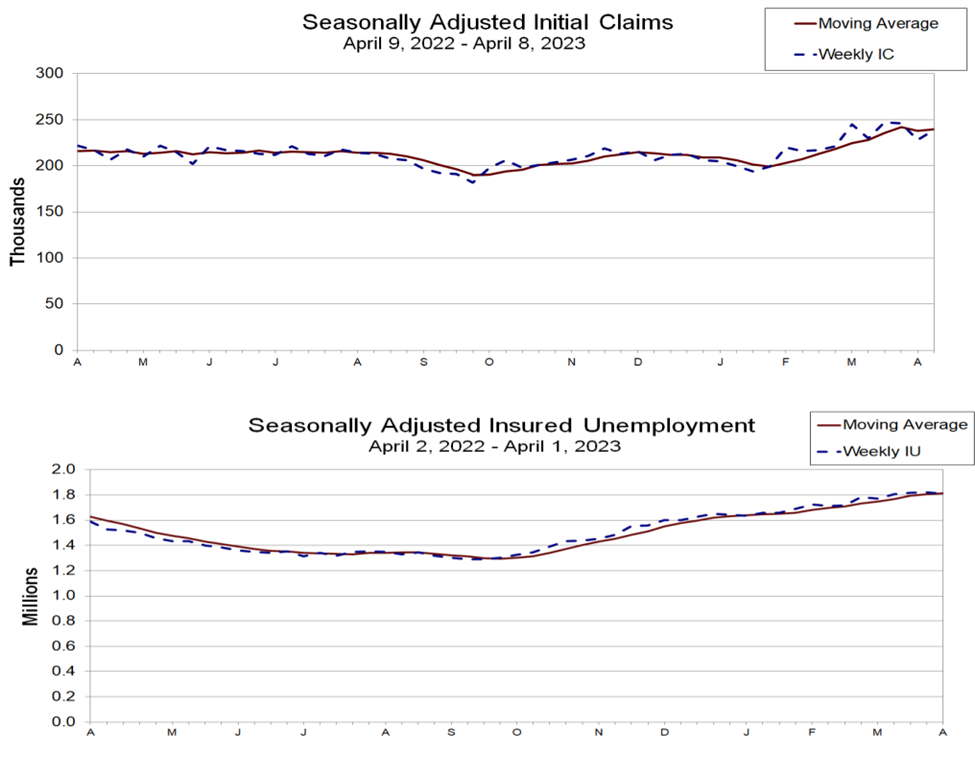
Initial jobless claims were flat at 262k, but above the expected 251k. Continuing claims increased by 20k to 1.775M. Even though these unemployment levels have been higher in recent weeks, they still are well below levels seen in all recessions of the past 4 decades that saw levels read higher than 350k.

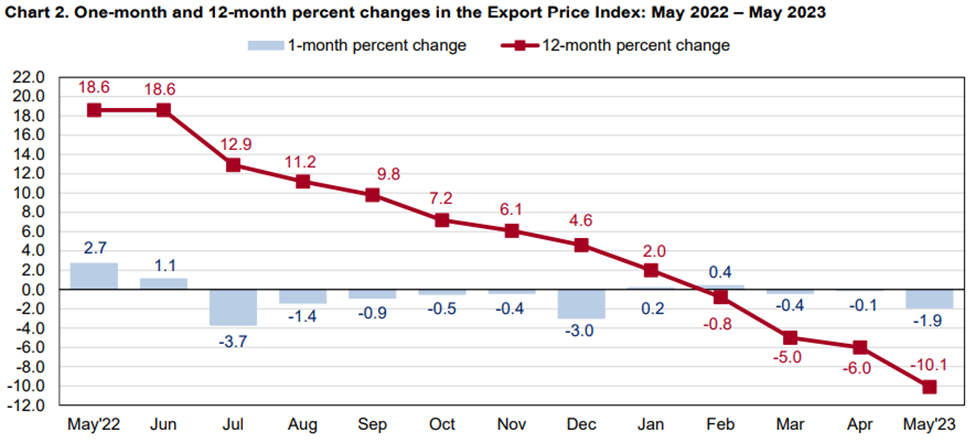
May import prices fell 0.6% MoM after a 0.3% increase in April. Excluding fuel, import prices were down 0.1%. Export prices fell 1.9% MoM after a 0.1% decrease in April. Excluding agriculture products, export prices fell 1.8%. Deflation can be seen in the import prices as they are down 5.9% YoY, nonfuel import prices down 1.9% YoY, export prices down 10.1% YoY, and non-agricultural products down 10.5% YoY.

Total industrial production fell 0.2% MoM, falling short of a +0.1% expectation. The capacity utilization rate fell to 79.6% from 79.8% reading in April. The report shows that manufacturing output is still positive, helping to mitigate weakness in mining and utilities output.

Friday:

The market closed out this quad witching day on a lackluster note, with major indices making moderate losses and spending most of the session near their flat lines. Mega-caps pulled down the indices with their outsized losses.

Pleasing earnings and guidance from $ADBE and Morgan Stanley calling $NVDA its top AI pick with a raised price target continued to drive the AI fever. The fever was not enough to offset the underlying weakness in the market for the day though.

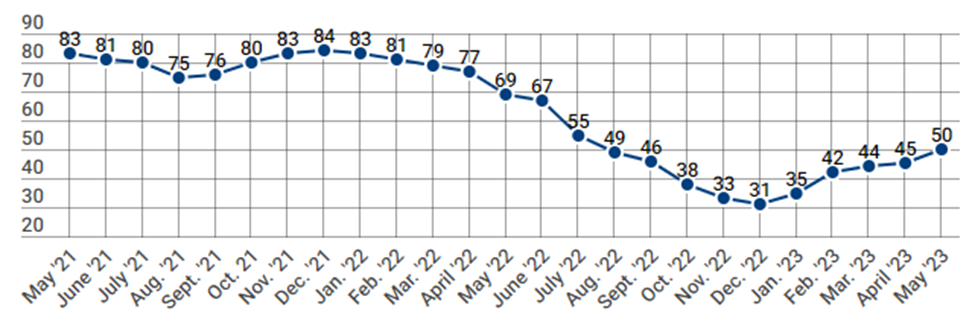
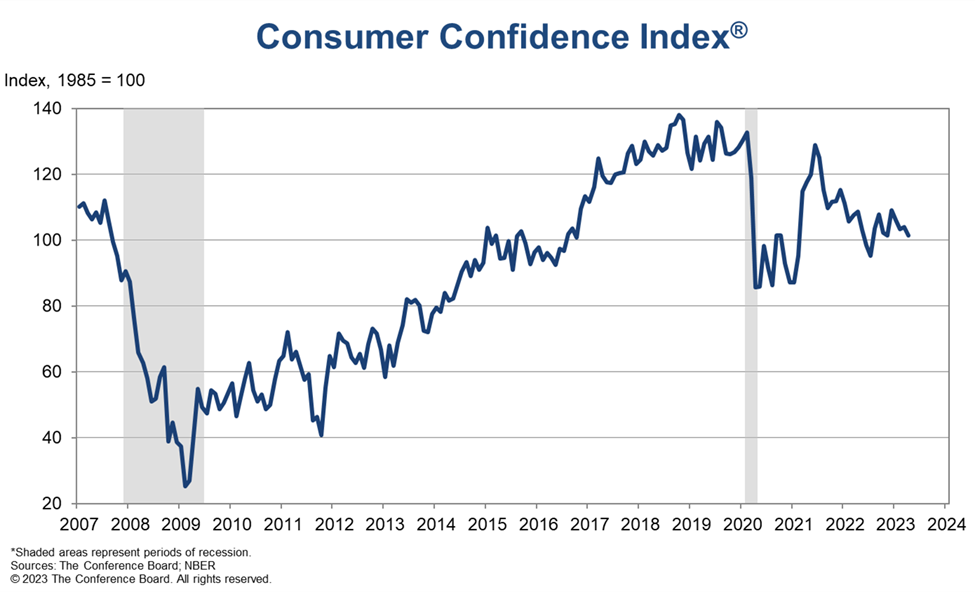
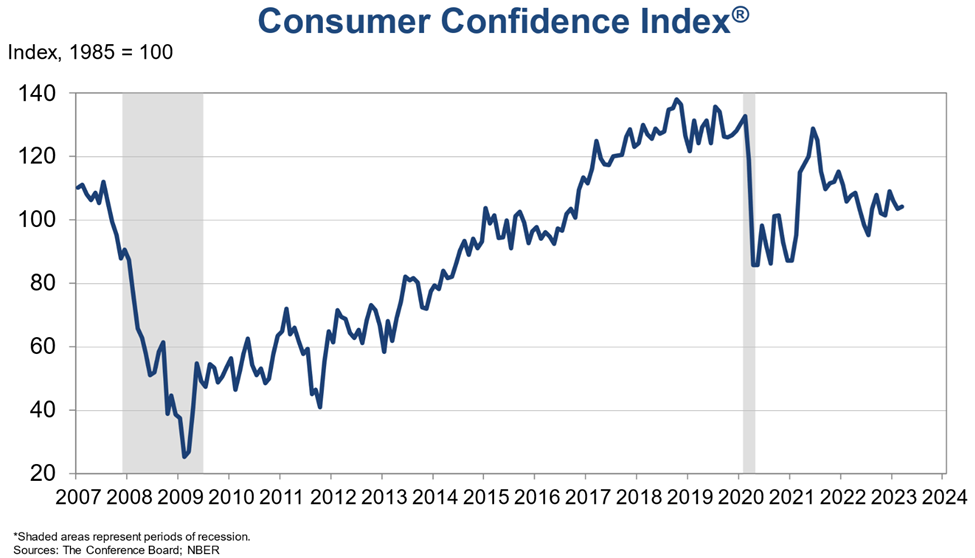
Economic data for the day was only the Consumer Sentiment Index. It came in at 63.9, above a 60.2 expectation and its 59.2 prior reading. A year ago today, the index was at 50.0. The report shows an easing inflation expectation underpinned by consumer sentiment, however, the report notes that many consumers still expect difficult economic times over the next year.

That’s it for my recap! If you would like to see how I am building my dividend portfolio using my predictions/strategy written here, you can read about my buys in my weekly portfolio update on this link.

And if you like updates like this, follow my Twitter or my CommonStock page where I post updates on the economic data throughout the week.

Have a happy Father’s Day and enjoy your three day weekend!

Regards,

Dividend Dollars

Categories
Economics Market Outlook Market Recap Market Update Stock Market

Stock Market Recap & Outlook (6/9­­­­/23) – A New Bull Market

This weekly market recap is brought to you by Koyfin, a powerful analytical tool that I am proud to partner with. Their platform is entirely customizable for whatever data you want to look at including stocks, ETFs, mutual funds, currencies, economic data releases (one of my personal favorites used often for these posts), crypto, and even transcripts of company events! Click the link above to get a special offer only for Dividend Dollar readers or go give my product review a read if you’re interested!

Dividend Dollars’ Outlook & Opinion

Apologies for missing last week as I was out of town! Typically, we start these outlooks in reviewing our last week’s prediction. Two weeks ago, we called for moderate bullishness contingent on a debt ceiling deal. Looks like we’ve got that AND SOME since out last article. Since I was out, Q1 2023 earnings season has nearly ended with only 2 S&P 500 companies left to report. Overall, Q1 earnings has beat on EPS 78% of the time and revenues 67%. Both earnings and revenues levels reported better than what was expected by analysts when Q1 ended.

Moving on from earnings, this was a very light week for economic data. Initial Jobless Claims came in much higher than expected meanwhile the Trade Deficit and Consumer Credit readings came in better than expected. The data for the week was equally mixed with results under and over expectations. Though one week’s economic data does not make a trend, the job numbers is this week carried the biggest significance marking the 18th straight week above 200k and the highest reading since November 2021. This shows that the Fed’s 15-month tightening efforts may finally be starting to impact the labor market. The CME’s Fedwatch tool shows a high probability of a rate hike pause at next week’s meeting, with a 71.2% chance of a pause and a 28.8% chance of a 25 bps hike. That is up from a 21.2% of a hike one month ago.

Technical’s-wise, with the debt ceiling resolved, earnings season over, a strong labor market, and most of the negative catalysts out of the way, the push higher for these last two weeks were not unexpected. The market broke through the 4,200 level that we made note of in the last edition, and pushed higher to the new bull market level. After four consecutive failed attempts to break above it, the market solidified it on Friday with a close above 4,292.44 for the day, meaning a new bull market officially began in October 12th, 2022 when that level was set. While it still has a long way to go to reach all time highs (+11.7%), the SPX is comfortably above all of its major moving averages and now has to fall 20% before this new bull market can end.

Next week we have the CPI releases for May on Tuesday, followed by the FOMC rate decision on Wednesday, retail and jobs data on Thursday, and finally consumer sentiment data on Friday. Though there aren’t many releases, next week does carry a few heavy hitters with the CPI and FOMC. A rate hike could occur on Wednesday and I don’t expect that the CPI reading a day before will affect the decision unless it comes in way above expectations.

Despite the market’s surprising strength, some analysts are still forecasting a recession in 2023. You could even argue that with the bear market now over, a pullback seems overdue. That may be true, however sentiment indicators shows that it is unlikely. VIX’s level, open interest change, and open interest put call ratio change are all at bullish levels. Major ETF open interest changes and put call ratio changes are also at moderately bullish levels. Only two indicators are in worse shape this week, but none have moved into bearish or moderately bearish territories. Indicators and sentiment lead me to believe next week will be a moderately bullish one. I would like to see SPX close above 4,340 to end next week, however, if the Fed surprises the market and raises rates, next week could be volatile and red. Keep you eyes on the rate hike probabilities and the meeting and react accordingly.

Weekly Market Review

Summary:

Though it wasn’t particular impressive, it was a very constructive week for the bulls as the 4th and 7th straight week of gains for $SPY and $QQQ. The S&P 500 climbed past 4,300 for the first time since August, but it couldn’t maintain that position on a closing basis, ultimately settling just a whisker shy of 4,300, but high enough to meet the definition of a new bull market.

Unlike previous weeks, it seemed that some money was rotating out of mega-caps into other areas of the market as the $RSP rose 1% while $MGK closed down 0.2%. With the exception of $TSLA, some profit taking was occurring. $TSLA rose 14.2% this week on an announcement of a charging network with $GM. Meanwhile, $AAPL closed flat after introducing its new augmented reality headset at its Monday conference.

The market also reacted to some softer labor data readings this week as the initial claims report came in surprisingly high. The May ISM non-manufacturing index also surprisingly dipped close to contractionary levels.

The financials sector had surprising gains this week, primarily off of news of receding banking risks and recession potential. 9 of the 11 S&P 500 sectors ended with gains, lead by consumer discretionary, utilities, energy, industrials, and financials. Technology and healthcare were laggards for the week.

Monday:

 The market closed a bit weakly after the ending rally of the prior week. Mega-cap strength supported the broader market, but it wasn’t enough to prevent the main indices from closing flat or slightly down. A fade started to occur after $AAPL and other mega-caps reacted to the news of the developer’s conference.

Growth concerns were also part of the narrative for the day as the ISM non-manufacturing index fell near to contraction areas. Weakness in bank stocks helped in the market’s downside efforts after the WSJ reported that large banks could face a 20% increase in capital requirements.

Economic data for the day included the IHS Markit Services PMI, the ISM Non-Manufacturing Index, and Factory Orders.

The PMI report rose to 54.9, up from 53.6. Service sectors continue to show a post-pandemic boom as spending switches from goods to services, however that is also where inflationary concerns lie. The survey data indicates that GDP is growing at an annualized rate of >2%.

The ISM for may fell to 50.3%, under a consensus of 52.3% and last month’s reading of 51.9%. Under 50% marks contractionary territory, so the May reading shows continued growth in the services sector, pulling growth away from manufacturing, but at a slower pace than last month. Survey respondents shows that business conditions are stable, yet concerns of a slowing economy are noted.

The Factory orders report increase 0.4% MoM, below a 0.8% expectation but up from a 0.6% increase in the prior month. Shipments of manufactured goods fell by 0.4% MoM after a 0.6% decline in March, showing that business spending may be picking up.

Tuesday:

The market had a decent day on Tuesday. The Russell 2000 showed nice gains while mega-caps lagged and dragged down the other indices. These rebounded around midday. The strength was evident in a 0.7% gain on the $RSP.

Strength in regional banks and energy stocks helped push the Russell to a 2.7% gain. The regional bank ETF $KRE was up 5% and the bank ETF $KBE was up 4.4%. Those moves were pushed by Goldman Sachs’ lowering their probability of a recession in the next year to 25% from 35% on account of improving banking risks.

For bad news, $COIN shares fell as the SEC charged the company for operating as an unregistered exchange, broker and clearing agency. There was no economic data to report for the day.

Wednesday:

Wednesday was upbeat despite mixed index performance. Mega-caps moved down, yet major indices held up well on higher than average volume. The Russel impressed again, gaining 1.8%. $AMZN, $MSFT, $NVDA, and $GOOGL all saw large declines as profit taking took place, pushing the $MGK down 1.7%.

Overall, the broader market was strong. The $RSP was up 0.7% as money flowed out of mega-caps into other areas with a bias towards economically sensitive sectors. Risings rates were a limiting factor for mega caps and growth stocks. Treasuries saw an uptick in selling after the Bank of Canada surprised with a 25 basis point rate hike.

Economic data for the day included the MBA mortgage report and the US Trade Deficit.

The weekly mortgage application index fell 1.4% with purchase applications down 2% and refinancing down 1%. The average interest rate of a conforming 30-year mortgage fell to 6.81%, down 10 basis points.

The US Trade deficit grew to $74.6B in April from a $60.6 reading in March. The widening deficit was the result of exports being $9.2B less than and imports being $4.8B more than March’s reading. This drop in exports shows a concerning decrease in demand for US goods.

Thursday:

Thursday was a decent day as mega caps drove action in early hours while the broader market was a bit weak. By the close, however, more stocks took place in the gains. $AAPL, $TSLA, $NVDA, and $AMZN (which was initiated with an overweight rating by Wells Fargo) recorded consecutive gains and were the biggest support factors in the market.

Market participants were also reacting to the weekly initial jobless claims report which came in at its highest level since November 2021, at 261k. This was worse than expectations by 24k. Continuing claims fell 37k to 1.757M. The bump in initial claims shows the softening in the labor market that the Fed has been wanting to see. Claims continue to be at levels above levels seen in prior recessions, which is a point that we were pleased to see. This was the only economic data for the day.

Friday:

Friday was mixed, but still closed out a constructive week for the bulls. The S&P 500 rose above 4,300 for the first time since August and marked a 20% gain on October’s low, which meets the criteria of a new bull market. That level couldn’t be held as we closed just under 4,300.

The mild gains for the day were broad based as the $RSP was up 0.1% and $MGK up 0.4% at close. It wasn’t this narrow at the open, but market breadth had shifted as the day progressed.

That’s it for my recap! If you would like to see how I am building my dividend portfolio using my predictions/strategy written here, you can read about my buys in my weekly portfolio update on this link.

And if you like updates like this, follow my Twitter or my CommonStock page where I post updates on the economic data throughout the week.

Regards,

Dividend Dollars

Categories
Earnings Economics Market Outlook Market Recap Market Update Stock Market

Stock Market Recap & Outlook (5/26­­­­/23) – A Whipsaw Week Fueled on Both Sides By AI and Debt Ceiling Issues

This weekly market recap is brought to you by Koyfin, a powerful analytical tool that I am proud to partner with. Their platform is entirely customizable for whatever data you want to look at including stocks, ETFs, mutual funds, currencies, economic data releases (one of my personal favorites used often for these posts), crypto, and even transcripts of company events! Click the link above to get a special offer only for Dividend Dollar readers or go give my product review a read if you’re interested!

Dividend Dollars’ Outlook & Opinion

Last week we called for a neutral to moderately bullish week in the market, and we got exactly that. The market moved slightly higher Monday, dropped hard Tuesday and Wednesday, before climbing back up the valley with strength on Thursday and Friday to end the week slightly in the green.

With the end of this week, earnings season is essentially over with 97% of companies having reported. 78% of companies reported positive EPS surprises with 76% reporting positive revenues surprises. The biggest surprise of all came from the $NVDA AI fueled earnings report. AI seems to have become a hot topic of conversation for this earnings season as a record number of companies mentioned the term in their earnings calls.

Aside from earnings, it was a fairly mild week for economic data. Core PCE came in very close to the estimates showing that inflation is still well above targets and jobless claims were lower showing that labor is still hot.

Technicals-wise, we finally got a little bit of a pull back this week on concerns of the debt ceiling. But then the unprecedented earnings report from $NVDA on Thursday singlehandedly turned things around. SPX, for another week, remains solidly above the 200, 100, and 50-day moving averages and is testing the 4,200 level for the 4th time in just two weeks. At the end of this week, a drop to the bear market low would take a 15% move, while the level needed to declare a new bull market is only 2% higher.

Even though next week is shorter with the holiday weekend, it still brings a good number of data releases. Next week is heavy with labor data releases, plus a consumer confidence reading, and ISM/PMI data. The current employment situation and inflation levels have raised the odds of another interest rate hike and I would be surprised to see if the coming data shifts that much.

As for sentiment indicators, there were a few more upgrades than downgrades. With VIX and ETF open interest changes, VIX and SPX open interest put/call ratio changes, and VIX implied volatility gap moving into more bullish territories while VIX and equity open interest and put call/ratio changes moved downward into neutral territories.

However, much like last week, since the debt ceiling issue is not resolved, this week’s outlook has a dual perspective again. With a no deal debt ceiling and the June FOMC meeting approaching, volatility is expected. On the other hand, if a ceiling deal is reached over the weekend even without being signed into law, a relief rally could result in a moderately bullish week ahead.

Weekly Market Review

Summary:

Much like how I finished this week on an upbeat note leading into the holiday weekend, the market did the same! Major indices saw some volatility as we dealt with a lot conflicting sentiments. Regardless, the SPX closed above 4,200 at its highest level since last August. Uncertainty about the debt ceiling and Fitch’s concerns about the US’s credit rating kept price action in check in the early week. However, by Friday, angst was eased as information on ceiling negotiations were released and $NVDA earnings charged the tech space.

Economic data this week corroborated some Fed members’ concerns that more rate hikes may be needed. Kashkari, Bullard, Waller, and Mester all were cited speaking this week that a pause isn’t guaranteed at this point. The higher-than-expected Q1 GDP report, lower than expected jobless claims, strong consumer spending, and uptick in PCE year-over-year all added to the case that more cooling may be needed.

Mega caps continued their outperformance with $MGK rising 2.2% this week versus a 0.3% gain in the market-cap weighted S&P 500. Meanwhile, the equal weight S&P 500 ETF $RSP fell 1.2%. The technology sector was the standout winner for the week while 8 of the 11 sectors all marked losses over 1% for the week.

Monday:

Monday had mixed action, but ultimately ended the day a little higher than the open, but not with much conviction as debt ceiling concerns were growing over the weekend. Janet Yellen reiterated that early June is the hard deadline for the ceiling and that the odds of the government paying its bills on the 15th are quite low.

Add to that commentary, the commentary from Fed President Kashkari that a decision to pause rate hikes in June is a close call and that a pause would not signify that tightening is over. Fed President Bullard also said that he thinks two more hikes are needed this year.

Stocks didn’t have huge reactions to these catalysts. The market clung to narrow ranges for most of the day while briefly peaking over the 4,200 level a few times. Price action could not hold above it, even with mega caps and bank stocks having a strong showing. The latter was spurred on by news that $PACW had entered into an agreement with $KW to sell a portfolio of real estate construction loans with a balance of $2.6B outstanding.

Tuesday:

Tuesday was another mixed day with no strength on either side of the tape. Mega caps dragged on the market, even though broader equities were holding up okay. Things began deteriorating as more press reports came out that a debt ceiling deal was far from agreed upon. House Speaker McCarthy said that a deal was nowhere near while House Minority Leader Jeffries said there is not a lot of progress being made.

The energy sector was the lone positive closer for the day, as $CVX offered a boost on its stock upgrade from HSBC. Consumer discretionary was down -0.9% as the outperformer, partially supported by $LOW’s earnings report.

Tuesday’s economic data included the IHS Market Manufacturing PMI and the New Home Sales Report. The latter event was up 4.1% MoM in April to an annual rate of 683k units, above the expected 660k and the 656k prior reading. Year-over-year sales were up almost 12%. Higher mortgage rates are holding down new homes sales activity as seen by the sales decline in the higher-priced Northeast and West regions that reflected affordability pressures.

The Manufacturing PMI fell to 48.5 in the preliminary May reading from 50.2 and back into contractionary territory. The Services PMI rose to 55.1 up from the 53.6 May reading, the highest level in 13 months. The Composite PMI was 54.5, also its highest level in 13 months. Overall, growth output seen in May was the fastest in over a year.

Wednesday:

Another weak showing happened this day, lead on by an approaching X-date for the ceiling battles. Reports of an impasse were somewhat corroborated by House Speaker McCarthy who told reporters that negotiations are still far apart on issues, but talks would continue.

The market also had to digest lingering rate hike concerns after Fed Governor Waller said that we need to maintain flexibility on the best decision to take in June… fighting inflation continues to be my priority. These concerns took a back seat to the debt ceiling angst though. The major indices all closed with losses, regardless of the attempted rebound in the late afternoon.

The weekly MBA Mortgage application Index came in Wednesday at 4.6% with a 4% drop in purchase applications and a 5% drop in refinance applications. With the average rate of a 30-year mortgage reaching its highest level since March, borrowers continue to be deterred.

Thursday:

Thursday was a mixed showing on the back of many news catalysts. The biggest one was $NVDA’s huge gain after reporting strong Q1 results with very optimistic Q2 guidance. $NVDA’s results fueled buyers in other semi’s and mega-cap stocks that propped up the broader market. Still though, market breadth reflected underlying weakness as Fitch watchlisted the US’s credit rating and Congress members reported their day off on Monday in spite of much needed continued negotiations. However, progress did seem to be made on negotiations and news said differences are narrowing.

Pleasant economic data with the Q1 GDP, jobless claims, and pending home sales came in.

US GDP growth during the Q1 period was revised higher to 1.3%, up from 1.1% in the initial estimate. The change was mainly a result of an upward revision to private inventory investment. Consumer spending was revised slightly higher to 3.8%, a good sign in spite of the ongoing inflation pressures.

Initial jobless claims rose less than expected to 229,000, vs estimates of 245,000. Claims were at 225,000 last week. Continuing claims were slightly lower at 1.79 million. Claims continue to be nowhere near recession levels and continue to reflect a hot labor market.

Pending home sales were flat in April, missing expectations of 1.0% growth. Pending home sales are down 20.3% YoY. Sales were up 3.6% in the Midwest and 4.7% in the West.

Friday:

Friday saw the market end the week on an upbeat note. Ceiling concerns seemed to ease somewhat as an solution was anticipated to be near. Mega-caps continued to boost the indices with economic data pointing to a resilient economy. Semiconductor stocks also continued to rally, with $SOX hitting a 6% gain after $MRVL reported good earnings and guidance.

The rally for the day was not weakened by rising concerns of another rate hike at the June meeting. According to the CME FedWatch Tool, there is a 64.2% chance of a 25 point hike, up from 51.7% yesterday and 13.7% a month ago. This followed the economic data releases for the day which showed strength and quelled worries of a hard landing. This data included the personal income and spending report, durable goods orders, trade in goods report, and consumer sentiment.

Personal income was up 0.4% MoM in line with expectations and above the 0.3% seen prior. Personal spending was up 0.8% MoM above the expected 0.4% and the 0.1% seen prior. The PCE Price index was up 0.4% MoM above the expected 0.3%. This was up 4.4% YoY versus the 4.2% seen last month. The Core PCE Price index was up 0.4% MoM above the expected 0.3% and was up 4.7% YoY versus the 4.6% seen last month. The 0.5% increase in real spending and the uptick in the YoY rates are the key takeaways here. This combination gives the Fed a reason to second guess if a pause is the right move now.

Durable goods orders rose 1.1% MoM in April versus an expected -1%. Excluding transportation, orders fell 0.2% MoM, lower than the expected -0.1%. The key in this report was that non-defense capital goods orders (a proxy for business spending) were up 1.4% MoM, a good sign.

The advanced international trade in goods report for April showed a growing deficit to $98.6B from an upwardly revised $82.7B deficit in March. This gap grew substantially as exports were $9.5B less than in March and imports were $4.5M more. Retail inventories jumped 0.2% while wholesale inventories fell by the same amount.

Finally, the University of Michigan Consumer Sentiment index hit 59.2 in May versus an expected 57.8. This is also higher than the preliminary reading of 57.7 but down from the April reading of 63.5. This time last year, the reading was slightly lower at 58.4. Consumer sentiment improved from mid-month, yet worsened from April as worries about economic outlook increased.

That’s it for my recap! If you would like to see how I am building my dividend portfolio using my predictions/strategy written here, you can read about my buys in my weekly portfolio update on this link.

And if you like updates like this, follow my Twitter or my CommonStock page where I post updates on the economic data throughout the week.

Regards,

Dividend Dollars

Categories
Earnings Economics Market Outlook Market Recap Market Update Stock Market

Stock Market Recap & Outlook (5/19­­­­/23) – A Strong Week Among a Continued Unsolved Debt Problem

This weekly market recap is brought to you by Koyfin, a powerful analytical tool that I am proud to partner with. Their platform is entirely customizable for whatever data you want to look at including stocks, ETFs, mutual funds, currencies, economic data releases (one of my personal favorites used often for these posts), crypto, and even transcripts of company events! Click the link above to get a special offer only for Dividend Dollar readers or go give my product review a read if you’re interested!

Dividend Dollars’ Outlook & Opinion

Last week we ended the outlook with neutral outlook call, which appeared to be correct up until mid-week. Q1 earnings season is nearing a close after this week, with 94% of companies having reported. 78% of companies reported a positive EPS surprise and 76% reporting positive revenue surprises. Despite the positive surprises, blended earnings results look to be -2% lower than the prior quarter, marking a second straight decline in earnings for the S&P 500.

What’s even more interesting is that more S&P 500 companies than normal have commented on a “recession” during their earnings calls. 107 companies used the term, which beats the 5 year average of 77 and 10 year average of 59 by a considerable margin. Unsurprisingly, the financials sector discussed it the most. However, it should be noted that this statistic appears to have peaked in Q2 of 2022.

Regardless of the earnings fun fact, this was a slow week for market data (yay these weeks make my job easier)! Initial jobless claims came in lower than expected and lower than last week, showing that jobs are still hot. The reading came in at 242k, the 15th consecutive week it has been above 200k. Housing data continues to come in hot. Retail, on the other hand, fell flat of expectations but was still positive. Next week we have new home sales on Tuesday, jobs, GDP, and pending home sales on Thursday, and PCE and sentiment on Friday.

For technicals, stocks continue to shock and confuse bears and naysayers. They continue to perform better than expected, especially with the unresolved debt ceiling battle. With a 1.8% gain on SPX this week, the chart has reached its strongest position year-to-date. It closed well above all major averages and is poised to break above the 4,200-resistance level (a level that has held for 7 straight weeks). At this point, falling back to the bear market region would require a 15% drop, while a rally to the bull region is now only 2% away.

Most indicators had positive moves this week, including the SPX open interest change, the VIX implied volatility gap, and the VIX futures levels. The composite levels of the indicators are primarily neutral or moderately bullish.

As for next week, the most important item is the PCE reading, as it is the Fed’s inflation gauge and a number of Fed speak this week reaffirmed the fact that their decision would be led by data. If we want a rate pause, this reading had better be good. However, since the next Fed meeting is still three weeks away, the PCE may not matter much in the near-term. If we assume this weeks positive moves were based on debt-ceiling optimism, it may not be shocking to see a quick decline if/when it happens. That may seem contrarian, but it is a buy-the-rumor and sell-the-news approach.

If there is no debt ceiling resolution, the whole picture points to more bullishness. If/when the debt ceiling is breached or lifted, volatility is the expectation, but direction will be determined by the catalyst.

Weekly Market Review

Summary:

The major indices gained this week, breaking a 6-week period of less than 1% moves for the S&P 500. The index reached new closing and intraday highs for the year but failed to maintain a position above 4,200, a level of strong resistance. While mega-cap stocks supported the index’s performance, the breadth of gains was wider this week. The S&P 500 rose 1.7%, while the Vanguard Mega Cap Growth ETF ($MGK) up 2.9% (why did I sell!) and the Invesco S&P 500 Equal Weight ETF (RSP) up 1.0%.

Signals were mixed this week. Optimism about a debt ceiling deal emerged after President Biden’s meeting with congressional leaders, but it waned when debt limit talks were paused according to Jake Sherman, a reporter for Punchbowl News. Some Federal Reserve officials expressed hawkish views, with Dallas Fed President Logan stating that current data doesn’t support a pause in June and St. Louis Fed President Bullard acknowledging the need for further rate hikes due to persistent inflation.

Treasury yields saw a decrease in the safety premium, especially at the short end of the curve, as investors considered the possibility of the Fed raising rates at the June FOMC meeting. The 2-year note yield rose by 29 points to 4.27%, and the 10-year note yield increased by 23 points to 3.69%. The bond market also reacted to positive sentiment about debt ceiling talks and favorable performance in regional bank stocks, with the SPDR S&P Regional Banking ETF (KRE) rising 7.8% and Western Alliance (WAL) experiencing a 24.9% increase on news of deposit growth.

Earnings reports from key retailers marked the week, with mixed reactions seen for Dow components Home Depot ($HD) and Walmart ($WMT). Target ($TGT) received a positive response, while Foot Locker ($FL) faced a significant decline of 27% after reporting disappointing earnings and issuing dismal guidance. The majority of S&P 500 sectors recorded gains, with information technology, consumer discretionary, communication services, and financials leading the way. However, the utilities sector experienced the largest decline, followed by real estate.

Monday:

Monday ended on a relatively positive note, although the price action was dismal with below-average volume. The major indices closed near their daily highs, posting modest gains. While there was initial weakness in mega-caps, some stocks in this category rebounded to finish with gains, contributing to the overall performance. Meta Platforms ($META) stood out with consistent outperformance after receiving an upgrade, while the Vanguard Mega Cap Growth ETF ($MGK) closed with a 0.2% gain.

The market’s inclination to buy mega-cap stocks reflected concerns about the uncertain debt ceiling situation, as President Biden’s meeting with congressional leaders on the topic approached. Regional bank stocks experienced a rally, providing support to the broader market. The SPDR S&P Regional Banking ETF ($KRE) had a 3.2% gain, and the S&P 500 financials sector closed near the top of the leaderboard with a 0.8% increase.

In terms of M&A activity, Newmont plans to acquire Newcrest for approximately $19 billion, and Oneok plans to acquire Magellan Midstream Partners for around $18.8 billion, including assumed debt. The market also saw positive regulatory developments, as EU regulators approved Microsoft’s acquisition of Activision. On the economic data front, the New York Fed Empire State Manufacturing Survey had a significant decline, with the new orders index dropping 53 points to -28.0, pointing to a sharp decrease in demand.

Tuesday:

The market looked in step with previous days, with limiting factors keeping it in check while gains from mega-cap stocks provided some support. However, the major indices closed near their lowest levels of the day following news that President Biden would be cutting his G-7 trip short. There was no information available about Tuesday’s debt ceiling meeting, but House Speaker McCarthy noted that the two sides remained far apart, while Senate Majority Leader Schumer emphasized the need for bipartisan agreement to avoid a default.

Despite losses in the overall market, gains in the mega-cap space helped mitigate the decline. The Invesco S&P 500 Equal Weight ETF ($RSP) dropped 1.4%, while the Vanguard Mega Cap Growth ETF ($MGK) recorded a 0.1% gain. The Dow Jones Industrial Average experienced the largest decline, partly due to Home Depot’s disappointing fiscal Q1 sales and guidance.

Retail sales data for April were released, indicating a 0.4% increase in total retail sales, but adjusting for inflation showed essentially flat sales, implying weaker demand. China also reported weaker-than-expected retail sales, industrial production, and fixed asset investment for April, contributing to concerns about global growth. Additionally, the FTC’s lawsuit to block Amgen’s acquisition of Horizon Therapeutics weighed on the stock and added further headwinds for equities.

Economic data for Tuesday included the April retail sales, industrial production, and the NAHB housing market index.

Retail sales came in at +0.4%, under the expected 0.7%. These readings are not inflation adjusted, so when making that adjustment, the reading is closer to flat. Growth in sales, therefore, was mostly due to price increases and not necessarily an increase in demand.

The industrial production report came in at +0.5%, compared to a flat expectation. Capacity came in just 10 basis points under the expectation at 79.7%. Manufacturing output bounced back in this reading, supported by gains in the output of vehicles and parts, defying a hard-landing economic scenario.

The NAHB housing index came in at 50, the 5th straight monthly increase and the highest level since July 2022. The index was expected to be flat at 45. Current sales, expectations, and buyer traffic were all higher.

Wednesday:

The stock market was soft right out of the gate, but found upside momentum. Gains built, aided by some short-covering activity. The major indices all closed near their best levels of the day.

Positive responses to earnings and other corporate news, along with an emerging hope that the president and congressional leaders are more aligned with debt ceiling negotiations, pushed things higher. Still, no deal has been reached and uncertainty remains in play. That uncertainty was not enough to offset Wednesday’s strong showing, a potential pro-cyclical bias.

Many stocks came along for the rally; 9 of the 11 S&P 500 sectors closed green. The financials sector lead with 2.1%. This came after Western Alliance ($WAL) said its deposits have increased by more than $2 billion since the end of the first quarter. This news put a bid in the bank stocks and the SPDR S&P Regional Bank ETF (KRE) jumped 7.4%.

Economic data included the MBA mortgage applications, housing starts and building permits.

The Mortgage Applications Index fell 5.7% with purchase applications falling 4.8% and refinancing applications falling 8.0%.

Total housing starts increased 2.2% MoM in April to a seasonally adjusted annual rate of 1.401 million compared to a consensus of 1.405 million. Single-family starts were up 1.6% MoM, but only because of a strong 59.5% increase in the West; single-family starts fell in all other regions.

Building permits fell 1.5% MoM to 1.416 million from an upwardly revised 1.437 million  in March. Single-unit permits rose 3.1% MoM, led by gains in all regions. The weakness in permits was driven by a 9.7% decline in permits for 5 units or more.

The key takeaway here is that single-family starts and permits were up, which is a positive given the tight supply of existing homes for sale. Even so, the constraints of high financing rates and high prices are evident in single-unit starts being down 28.1% year-over-year and single-family permits being down 21.2% YoY.

Thursday:

It was another good day for stocks, building on Wednesday’s gains. The major indices traded in mixed fashion until a late afternoon surge higher. That move saw the S&P 500 break the 4,200 level for the 1st time since August 2022. Ultimately, the S&P 500 closed at its best level of the year, just a whisker shy of 4,200.

The midday lull was probably ongoing hesitancy about the debt ceiling. House Speaker McCarthy said he “sees a path” to getting the debt limit bill on the House floor for a vote next week, yet other press reports suggest a debt ceiling deal won’t be easy to reach.

Market participants were also reacting to some mixed economic data, including lower-than-expected jobless claims, a better-than-expected Philadelphia Fed Index for May, and weaker-than-expected existing home sales and leading economic indicators for April.

Nonetheless, the afternoon rally was fairly broad based, ratcheting up as the mega cap stocks took another leg higher along with the semiconductor stocks both having several names reaching new 52-week highs.

Friday:

The stock market kicked off this options expiration day on an upbeat note, but ultimately rolled. Opening gains had the S&P 500 back above the 4,200 level before the market turned lower middaywhen Fed Chair Powell began speaking at a panel discussion regarding perspectives on monetary policy.

However, stocks seemed to be responding to worries about the debt ceiling and regional banks, rather than Mr. Powell’s comments. Briefly, Mr. Powell said that inflation is “far above” the Fed’s objective, but also said that rates may not have to rise as much because of credit conditions. These views were comparable to what he shared during his press conference following the FOMC meeting earlier this month, so they weren’t necessarily surprising.

What was surprising was the prior mentioned tweet from reporter Jake Sherman that “debt limit talks between the White House and House Republicans have been paused, per multiple sources involved in the talks.”

Ultimately, the major indices were able to climb somewhat off their lows to close with modest losses; however, the S&P 500 remained pinned below 4,200 on a closing basis.

That’s it for my recap! If you would like to see how I am building my dividend portfolio using my predictions/strategy written here, you can read about my buys in my weekly portfolio update on this link.

And if you like updates like this, follow my Twitter or my CommonStock page where I post updates on the economic data throughout the week.

Regards,

Dividend Dollars

Categories
Earnings Economics Market Recap Market Update Stock Market

Stock Market Recap & Outlook (4/28/23) – Earnings Lead the Market While Economics Are Mixed

This weekly market recap is brought to you by Koyfin, a powerful analytical tool that I am proud to partner with. Their platform is entirely customizable for whatever data you want to look at including stocks, ETFs, mutual funds, currencies, economic data releases (one of my personal favorites used often for these posts), crypto, and even transcripts of company events! Click the link above to get a special offer only for Dividend Dollar readers or go give my product review a read if you’re interested!

Dividend Dollars’ Outlook & Opinion

Last week we were hesitant to make any call aside from volatility on account of earnings being the main item that would control price action this week. Earnings did push the market higher by roughly 1%, with over a 2% swing from the mid-week low to the end-of-week high. I’d say the volatility call and its reasoning was correct.

This week was a volatile fight higher as surprisingly solid earnings and a strong labor market continues to out-bull the bears of declining sentiment and recession fears. We had a decent chunk of economic releases, and most surpassed expectations, helping the grind higher.

The first key to the week was the that Q1 GDP advance estimate came in at +1.1%, compared to +2.6% in 22Q4 and +3.2% 22Q3. Q1 GDP was below the market consensus of near 2% but was on point for the Atlanta Fed GDPNow forecast. Inflation continues to be a weight on non-inflation GDP growth which was +5.1% in Q1. That would be a stellar reading in a normal inflation environment, but with inflation at 4%, we end up with just 1.1% real GDP.

Next was Q1 earnings reports. This earnings season is about half way through, with just over 250 of the S&P 500 companies having completed their reports. So far, 94% of the reporters have beat the EPS estimates, 69% have beat their revenue estimates. From an aggregate basis, the Q1 earnings are down 1.7% year-over-year compared to a -6.6% estimate at the end of Q1. Q1 revenues are up 4% YoY compared to 1.9% expected growth. In comparison to what was expected, this earnings season has been impressive to say the least.

When thinking of the potential headwinds that could slow the market, one could put together a pretty solid list. We have consistent inflation concerns, economists’ warnings of a recession, a debt ceiling debate in Congress, and another potential FOMC rate hike next week. Strong earnings and strong labor markets are enough to keep us bullish, apparently.

This week we saw $SPX briefly dip below the stubborn technical level at 4,100 again, but it has closed comfortable above it this week. Equities in general are doing terrifically compared to what most forecasters expected YTD. The long-term downtrend is far away and $SPX is well above all significant SMAs. At this point, falling back down to bear market lows would require a very scary decline in the market. Yet, on the other hand, a little bit more of a rally would be enough to call a new bull market at just 2.8% higher than current levels.

Going into next week, it is highly likely that we see another 25-basis point rate increase. Then, the second half of the week will be filled with employment data. As earnings continue, there’s no doubt in my mind we will continue to see some strong price action. With that said, the job market has not deteriorated much yet combined with the fact that the second half of earnings could easily be as strong as the first half, next week looks poised for gains and volatility. However, overall performance for next week will ultimately be determined by the reaction to the FOMC decision and if continued earnings surprises can negate a downward move or enhance an upward one.

Weekly Market Review

Summary:

All major indices closed the last week of April with gains except for the Russell 2000. Investors received tons of earnings news and economic data this week, which all reflected mixed activity. Those mixed results fueled a midweek sell-off before a strong rally effort during the last 2 days. 

Earnings results from many mega cap stocks like $MSFT, $GOOG, $AMZN, and $META pulled a lot of focus this week. Unsurprisingly, their reports received mixed reactions from investors.

$GOOG and $AMZN declined on their earnings reports, with the latter warning about slowing cloud services growth, while $MSFT and $META made gains. Nonetheless, mega cap stocks moved the indices higher. The Vanguard Mega Cap Growth ETF ($MGK) rose 1.9% on the week. 

On the flip side, some earnings reports contributed to economic growth concerns. Most notably, $UPS, $DOW, $TXN, and $NSC all disappointed with their earnings/guidance.

$FRC fallout continued after its disappointing earnings, which featured a 40% decline in deposits and renewed lingering worries about tighter lending standards and deposit costs.

Economic data this week showed mild weakness, yet there was no clear signal that the economy is deteriorating rapidly. The advance Q1 GDP report didn’t look great on the surface with real GDP increasing at an annualized rate of 1.1% after increasing 2.6% in Q4. However, personal consumption expenditure growth rose 3.7% from 1.0% in the Q4. 

The March Durable Orders report enhanced slowdown concerns due to a 0.4% drop in nondefense capital goods orders in March, a gauge for business spending. Separately, the labor market remains strong as seen in the initial jobless claims staying far away from levels that have been seen in past recession.

The S&P 500 communication services sector (+3.8%) was the top gainer this week, followed distantly by information technology (+2.1%) and real estate (+1.5%). The utilities (-0.9%) and industrials (-0.6%) had the largest losses.

Monday:

Stocks had a lackluster showing on Monday. We were in wait-and-see mode ahead of big  earnings news and economic dat. The main indices logged only modest gains or losses, ultimately settling the session in mixed fashion.

The hesitancy on Monday came ahead of a slate of important economic data this week, including the Fed’s preferred inflation gauge Core PCE on Friday along with big tech earnings throughout.

Without a lot of market-moving catalysts, mega cap stocks drove a lot of the index moves. The Vanguard Mega Cap Growth ETF ($MGK) was down 0.2% while the Invesco S&P 500 Equal Weight ETF ($RSP) rose 0.2% and the market-cap weighted S&P 500 was up 0.1%.

Dow component Coca-Cola ($KO) initially moved higher as investors digested a better-than-expected Q1 earnings report, but KO gave back those early gains to close with a slim loss.

Tuesday:

Stocks were in a solid range before finally giving up on Tuesday. The major indices all registered decent losses despite roughly 75% of companies reporting beating earnings expectations.

Growth concerns drove Tuesday’s price action following First Republic Bank’s (FRC) disappointing earnings results as previously mentioned. The report renewed lingering worries about banks facing higher deposit costs and tighter standards. Sentiment around FRC deteriorated further following news that a team of wealth advisors managing $13 billion in assets may leave the bank, and other news they are considering an asset sale. The stock was halted and  faced ongoing selling pressure after it reopened.

UPS’s earnings report contributed to slowdown worries after the company lowered FY23 guidance due to macroeconomic conditions and “changes in consumer behavior.”

This all offset any strength from other companies that reported earnings and made gains like $VZ, $PEP, and $KMB.

Economic news for Tuesday included the national home price index, US home sales, and the consumer confidence index report.

The FHFA Housing Price Index rose 0.5% in February compared to a revised 0.1% in January.

The S&P Case-Shiller Home Price Index fell to 0.4% in February versus a flat consensus. Last month’s reading was at 2.6%.

New home sales rose 9.6% MoM in March to a seasonally adjusted annual rate of 683,000 units, well above expectations. On a year-over-year basis, new home sales were down 3.4%. The takeaway from the report is that new home sales activity is being helped by the tight supply of existing homes for sale, although affordability issues with higher prices and higher mortgage rates are still dampening stronger new home sales activity. Homebuilder stocks reacted positively to the news.

The Conference Board’s Consumer Confidence Index for April fell to 101.3, well below the expected 104. One year ago, the index was at 108.6. The takeaway from the report is that consumers were more pessimistic about the outlook of business conditions and the labor market, which translated into another sub-80.0 reading for the Expectations Index. This was the 13th sub-80 reading in the last 14 readings. A level below 80.0 is a level associated with a recession within the next year.

Wednesday:

The market closed mixed, yet skewed negative under the surface. Price action was especially disappointing when considering the 7.2% gain in $MSFT after earnings. The market moved higher early on thanks in large part to support from the mega cap space, but ultimately closed near their lows of the day.

Even $GOOG, which had been up as much as 2.3% after reporting better than expected/feared quarterly results, closed the session with a slim loss.

The negative bias was stemming from growth concerns on bank fallouts, debt ceiling matters, and the Fed’s policy path.

Relatively disappointing guidance from $TXN and $NSC and the 0.4% decline in nondefense capital goods orders in March, a gauge for business spending, piled onto the slowdown concerns.

Separately, the U.K.’s CMA said it will block Microsoft’s acquisition of Activision Blizzard ($ATVI), which weighed heavily on the latter stock. I wrote a separate article specifically on that news here.

Economic data for Wednesday included the MBA mortgage application and the durable goods orders report.

Weekly MBA Mortgage Applications Index 3.7% compared to -8.8% last week. March Durable Orders 3.2% well above consensus of 0.7%. The key takeaway from the report, though, is that non-defense capital goods orders excluding aircraft, a gauge for business spending, declined 0.4% in March following a 0.7% decline in February.

Thursday:

The stock market had a decidedly strong showing on Thursday. The major indices regained all of their losses from Wednesday and then some. The broader market was boosted by a huge gain in $META after its earnings report. As a result, other mega cap stocks logged outsized gains, driving a 2.6% gain in the Vanguard Mega Cap Growth ETF ($MGK).

The positive price action was improved by beneficial economic outlooks. Favorable earnings and/or guidance from the industrials sector and other companies, along with the healthy 3.4% increase in real final sales in Q1 and initial jobless claims that continue to run well below recessionary levels, helped to calm concerns about the economy being at imminent risk of a hard landing.

Earnings-driven gains in $META and $CMCSA propelled the communication services sector to first place on the leaderboard by a big margin. The consumer discretionary (+2.8%), real estate (+2.4%), and information technology (+2.2%) sectors were also among the outperformers.

Economic data for Thursday included the advance Q1 GDP report, initial jobless claims, and the pending home sales report.

The Advance Q1 GDP report wasn’t as underwhelming as it appeared to be at first read. Real GDP increased at an annualized rate of 1.1% compared to 2% expectations and a 2.6% Q4. The GDP Price Deflator increased to 4%. The key takeaway from the report is that the deceleration in growth wasn’t because of weak consumer spending. Actually, personal consumption spend growth picked up in Q1 to 3.7% with spending on goods up 6.5% and spending on services up 2.3%. The hit to growth came from the change in private inventories.

Initial jobless claims for the week fell by 16,000 to 230,000 while continuing jobless claims for the week ending April decreased by 3,000 to 1.858 million. The key takeaway from the report is that initial jobless claims remain a long way from the levels that have been seen in past recessions with an average above 375,000.

Pending home sales dropped 5.2% in March (Briefing.com consensus 1.0%) following a 0.8% increase in February.

Friday:

The market built on Thursday’s gains, closing near their highs of the session, despite a sizable decline in $AMZN after the company warned slowing cloud services growth after its better than expected Q1 report.

Nice gains from some blue chip names like $XOM, $CL, and $MDLZ supported the broader market while sharp earnings-related losses in $PINS and $SNAP kept the Nasdaq trailing its peers.

Economic data for Friday included the Q1 employment cost index, the PCE price index, the personal income and spending report, and the consumer sentiment index.

The Q1 Employment Cost Index increased 1.2% for Q1 2023. Wages and salaries, which account for about 70% of compensation costs, increased 1.2% following a 1.2% increase from last month. The key takeaway from the report is that labor costs didn’t show any signs of deceleration. Compensation costs for civilian workers increased 4.8% YoY while benefit costs increased 4.5%.

There weren’t a lot of surprises in the March Personal income and Spending Report. Personal income increased 0.3% MoM and personal spending was flat.

The PCE Price Index was up 0.1% and the core PCE Price Index, which excludes food and energy, was up 0.3%. The key takeaway from the report is that the core PCE Price Index, the Fed’s preferred inflation gauge, held fairly steady at persistently high levels, checking in at 4.6% YoY. The stickiness of that component should keep the Fed sticking to its rate-hike ways.

The final University of Michigan Consumer Sentiment Index for April read at 63.5, in-line with the preliminary estimate. The final reading for March was 62.0. A year ago, the index stood at 65.2. The key takeaway from the report is that consumer sentiment remains pinned at lower levels, stemming in part from inflation pressures that are dragging on attitudes about personal finances due to higher expenses.

That’s it for my recap! If you would like to see how I am building my dividend portfolio using my predictions/strategy written here, you can read about my buys in my weekly portfolio update on this link.

And if you like updates like this, follow my Twitter or my CommonStock page where I post updates on the economic data throughout the week.

Regards,

Dividend Dollars

Categories
Economics Market Recap Market Update Stock Market

Stock Market Recap & Outlook (4/21/23) – A Flat Week as Earnings Provide No Direction And A Rate Hike Looms

This weekly market recap is brought to you by Koyfin, a powerful analytical tool that I am proud to partner with. Their platform is entirely customizable for whatever data you want to look at including stocks, ETFs, mutual funds, currencies, economic data releases (one of my personal favorites used often for these posts), crypto, and even transcripts of company events! Click the link above to get a special offer only for Dividend Dollar readers or go give my product review a read if you’re interested!

Dividend Dollars’ Outlook & Opinion

If you read last week’s outlook, you’ll know that our outlook for this week was for volatility on account of earnings only to end the week flat. Last Friday, $SPX closed at 4,137 and this week it closed at 4,133. Sorry I was off by 4, but if we are understanding I would say we were spot on this week. Price action was choppy as earnings are better than feared but market positioning and sentiment are bearish, valuation is full at a forward P/E of 19 and the Fed could still make rate moves soon. Next week will likely help decide direction for the market as a result of mega-cap tech earnings.

First quarter 2023 earnings have rolled in this week with 87 of the 500 S&P companies reporting. 54% of those beat the top line and 75% on the bottom line, compared to 58% and 70% respectively last quarter. Next week is busy with earnings from mega-caps such as $KO, $PEP, $MCD, $MSFT, $GOOG, $V, $META, $AMZN, $BA, $INTC, $XOM, $CVX, and more.

Technicals-wise, the S&P 500 seems to be stalling around the top of the 3,800-4,200 trading range. Near term, the upside bs downside potential is in favor of the bears assuming the range remains intact. However, next week’s earnings could easily swing the market in either direction. If $SPX is able to break above 4,200, it could see buyers scramble to scoop up more as sentiment shifts away from the bearish scope we are currently in.

This week we got a decent dose of economic data and the results were mixed. PMI’s were hot, jobless claims were in line, and housing/construction disappointed. Next week we’ve got consumer confidence reports, retail, GDP, and PCE readings to look forward to. GDP will likely be the key. Of course inflation is still very important to the market, so Friday could prove particularly volatile.

Stocks were flat across the board. The market appears to be waiting for mega-cap tech earnings reports or the May FOMC meeting. Given the fact that many of the major indices on sitting near range level highs and earnings have the potential to move us in either direction, my outlook for next week is breakout.

I am loath to call a direction, because really it is up the earnings reports and economic data releases. It is entirely possible that we just hang out at resistance for another week to see what the Fed says, but to me it feels like the tech stocks have the power next week to swing us higher or lower, entirely dependent on their earnings reports.

Weekly Market Review

Summary:

The stock market didn’t move in either direction this week. The S&P 500 closed at 4,137 last Friday, then closed at 4,133 this Friday. Investors were playing a waiting game ahead of a big batch of earnings results next week. These reports will follow disappointing Q1 results from Tesla ($TSLA), which fell nearly 10% on Thursday.

On the other hand, Dow component Procter & Gamble ($PG) rose 3.5% on Friday as investors digested its pleasing fiscal Q3 results and affirmation of its FY23 EPS outlook.

Bank stocks were weak this week following earnings reports from some regional banks like Zions Bancorporation ($ZION), Truist Financial ($TFC), and Western Alliance Bancorp ($WAL). Despite regional bank weakness, the S&P 500 financial sector was among the top performers with a 1% gain.

Other top performing sectors include real estate (+1.58%), consumer staples (+1.85%), and utilities (+1.06%). The communication services (-2.6%) and energy (-2.5%) sectors were the worst performers by a wide margin.

Weak economic data also contributed to the hesitant mindset that slower growth will put pressure on future earnings. Data releases this week featured the highest continuing jobless claims level since November 2021, the weakest reading for the Philadelphia Fed Index  since May 2020, the weakest level for the US Leading Economic Index since November 2020, and a 22% YoY decline in existing home sales in March.

The market shows a belief that the Fed will keep rates higher for longer. Philadelphia Fed President Harker said the Fed is going to need to do more to get inflation back down to target, New York Fed President Williams also showed support for another rate hike at the May FOMC meeting. Unlinked here, but Fed President Bullard and Fed President Bostic also supported higher rates for longer in talks this week.

This commentary from Fed officials contrasts the fed funds futures market, which is pricing in two rate cuts before the end of the year, according to the CME FedWatch Tool.

Monday:

The stock market spent most of the day in a range that included modest losses for the Dow, Nasdaq, and S&P 500. There was no conviction ahead of earnings news this week. Earnings results so far have been better than expected/feared, which helped limit selling interest, but valuation concerns kept the market from moving noticeably higher.

The market was able to log gains, though, thanks to a late afternoon rebound effort. The indices all finished at their best levels of the day, leaving the S&P 500 just above 4,150. Even semiconductor equipment makers, which had been a notable spot of weakness, came along with the rebound.

Economic data for Monday included the Empire State Manufacturing Index and the NAHB Housing Market Index.

The April Empire State Manufacturing hit a reading of 10.8  versus a consensus of -19 and the last reading of -24.6. This is the first reading of solid business activity increase in New York in five months.

The April NAHB Housing Market Index came in at 45, in line with expectations and just above lost month’s reading of 44.

Tuesday:

Tuesday’s session was mixed. The main indices spent most of the day trading right around their flat lines. Investors were reacting to a slate of earnings news, some positive economic data, and commentary from a few Fed officials as previously mentioned.

Following their better-than-expected Q1 earnings, Bank of of America ($BAC) and Lockheed Martin ($LMT) were among the more influential winners on Tuesday. BAC, which was down as much as 1.9% at one point, helped drive a 0.3% gain in the S&P 500 financial sector and LMT helped propel the industrials sector (+0.5%) to the top of the sector leaderboard.

Meanwhile, Dow components Johnson & Johnson ($JNJ) and Goldman Sachs ($GS) registered large losses following their earnings reports. Both companies reported better-than-expected Q1 earnings, but GS came up shy with its revenue.

Bank stocks in general were weak. Notably, homebuilders were a pocket of strength after the better-than-expected housing starts data from March, which was accented with welcome gains in both starts and permits for single family units.

Economic data for Tuesday included the Housing starts report.

Total housing starts fell 0.8% in March to a seasonally adjusted annual rate of 1.420 million, 1.407was expected. The decline was due to falling multi-unit starts. Single-unit starts were up 2.7% MoM. Building permits fell 8.8% MoM, driven by a 24.3% decline in permits for 5 units or more, whereas single-family permits increased 4.1% MoM. The key takeaway from the report is the growth seen in single-family starts and single-family permits (a leading indicator) which is needed given the limited supply of existing homes for sale.

Wednesday:

Again, the market had a lackluster showing. Major indices were in narrow trading ranges, registering only modest gains or losses throughout the session. The sideways action was the culmination of wait-and-see mindset ahead of earnings reports from most mega cap stocks next week and Tesla ($TSLA) after Wednesday’s close.

The market had more negative bias initially, but several mega cap stocks recovered from early weakness and boosted index performance. The main indices closed off their lows of the day with $AAPL, $AMZN, and $NVDA as some of the notable winners.

Outsized moves were mostly reserved for stocks with specific catalysts in earnings surprises. Morgan Stanley ($MS) closed with a nice gain, rebounding from an opening 3.7% decline following its earnings results.

Treasury yields rose Wednesday, which acted as a headwind for equities. Price action in the bond market was a reflection of concerns about Fed policy.  Some persistently high core inflation data for the eurozone and UK in March also contributed to selling interest.

Wednesday economic data included only the MBA Mortgage Application Index. The index fell 8.8% with purchase applications tanking 10% and refinance applications dropping 6%

Thursday:

Thursday was the day we finally say some solid intraday moves. Economic data was weak and disappointing earnings results from Tesla ($TSLA) kept us down. Bank stocks were also a big drag following several earnings misses from regional banks.

Despite Tesla’s sizable decline and other headwinds, index level performance was fairly resilient until mid-afternoon. Some relative strength from other mega cap names lead rebound effort midday and then hit a pullback looked technical in nature after the S&P 500 failed to break above the 4,150 level, hitting 4,148 at its high of the day.

There were some big outperformers Thursday, however. Homebuilders ran following D.R. Horton’s (DHI) impressive quarterly results and outlook. This fueled buying interest in other homebuilders as evidenced by the 1.7% gain in the iShares U.S. Home Construction ETF (ITB) and a 0.7% gain in the SPDR S&P Homebuilder ETF (XHB).

Economic data for Thursday included

Initial jobless claims for the week ending April 15 increased by 5,000 to 245,000 (Briefing.com consensus 242,000) while continuing jobless claims for the week ending April 8 increased by 61,000 to 1.865 million.

The key takeaway from the report is that continuing jobless claims are at their highest level since November 27, 2021, suggesting it is becoming more challenging to find new employment after a layoff.

The April Philadelphia Fed Index slumped to -31.3 (Briefing.com consensus -20.0) from -23.2 in March. That is the eighth straight reading in negative territory for this manufacturing survey and the lowest reading since May 2020. The dividing line between expansion and contraction for this report is 0.0.

With the diffusion index for general activity running at -1.5 (versus -8.0 in March), the key takeaway from the report is that respondents’ expectations for growth over the next six months remain subdued.

Existing home sales declined 2.4% month-over-month in March to a seasonally adjusted annual rate of 4.44 million (Briefing.com consensus 4.50 million) versus a downwardly revised 4.55 million (from 4.58 million) in February. Sales were down 22.0% from the same period a year ago.

The key takeaway from the report is the recognition that the inventory of existing homes for sale remains extremely tight, which is due in part to the strength of the labor market (and ability to work remotely) and the jump in mortgage rates that is deterring existing home owners’ interest in moving.

The Leading Index was down 1.2% in March (Briefing.com consensus -0.4%) after falling a revised 0.5% (from -0.3%) in February.

Weekly natural gas inventories increased by 75 bcf after increasing by 25 bcf a week ago.

Friday:

The market made a slim gain on Friday’s options expiration day, but that wasn’t an impressive feat. The market was little changed from Thursday’s closing levels for the entire session.

In general, outsized moves were limited to individual stocks like Dow component Procter & Gamble ($PG), which reported pleasing fiscal Q3 results and affirmed its FY23 EPS outlook, and HCA ($HCA), which also reported favorable earnings.

Bank stocks were under pressure Friday after underperforming for most of the week. This weakness followed disappointing earnings from Regions Financial ($RF).

The materials sector (-0.9%) logged the biggest Friday decline due to a sizable loss in Freeport McMoRan ($FCX) following its earnings report and a loss in Albemarle ($ALB) in response to reports that Chile is planning to nationalize its lithium industry.

Friday’s economic data included the IHS Manufacturing PMI and the Services PMI.

April IHS Markit Manufacturing PMI preliminary reading came in at 50.4, compared to 49.2 from last month. The Markit Services PMI was 53.7 compared to 52.6 last month.

That’s it for my recap! If you would like to see how I am building my dividend portfolio using my predictions/strategy written here, you can read about my buys in my weekly portfolio update on this link.

And if you like updates like this, follow my Twitter or my CommonStock page where I post updates on the economic data throughout the week.

Regards,

Dividend Dollars

Categories
Earnings Economics Market Recap Stock Analysis Stock Market

Stock Market Recap & Outlook (4/14/23) – Picking Up Steam Into Earnings

This weekly market recap is brought to you by Koyfin, a powerful analytical tool that I am proud to partner with. Their platform is entirely customizable for whatever data you want to look at including stocks, ETFs, mutual funds, currencies, economic data releases (one of my personal favorites used often for these posts), crypto, and even transcripts of company events! Click the link above to get a special offer only for Dividend Dollar readers or go give my product review a read if you’re interested!

Dividend Dollars’ Outlook & Opinion

Boy is this market difficult to wrap your head around. From a bullish perspective, inflation has continued to trend lower, earnings kicked off to a solid start, and consensus sentiment may be too bearish and lead to a continued “melt up” so-to-speak. On the other hand, bearish perspective is that valuations are too high, technicals show we are close to strong resistance levels, and there is still too much uncertainty surrounding global economic health, inflation, and rate movements.

This week was heavy with economic data that contributes to everyone’s potential differences in market perspectives (all of these releases will be broken down in the recap below). We received good news on the inflation front, but bad news in soft retail sales and rising unemployment claims. The consumer sentiment report surprised with higher-than-expected inflation expectations. Q1 earnings from the big banks came in above analyst estimates, with more to come next week.

Last week we said that this week was technically bearish but positive data and earnings report could “flip the script”. That’s exactly what we saw. Two weeks ago, we also mentioned that April tends to be a relatively bullish month. Though the first week of the month didn’t hold true, this week definitely did.

Technicals-wise, the S&P 500 is nearing the upper end of the 3,800-4,200 range that was established in November. From a technical near-term perspective this skews favor to the bears. It is possible that the uptrend continues and breaks above the range, but this may be difficult for a number of reasons. For one, the current forward PE multiple is roughly 19, and earnings revisions aren’t shifting up to justify a higher multiple.

We have a fair number of economic data releases next week, but none of them really stand out. All eyes will be on earnings reports which include some big names like $JNJ, $BAC, $NFLX, $WMT, $TSLA, $T, and $PG.

As these earnings reports roll in, expect volatility. But it’s impossible to know if they’ll be positive or negative for the market. Therefore, I think the official and safe outlook for next week is volatile and neutral with an expected week ending next week around current prices, especially since upper resistance on the SPX is close. However, the bull in me really wants to see earnings surprises push the market higher to 4,200 and even above. But only time will tell.

Weekly Market Review

Summary:

The stock market had a mixed but overall positive showing for the week. All major indices made gains, but modest ones on the back of continued inflation and Fed concerns.

Early week was a slow trend up as investors awaited economic data and Q1 earnings reports from banks on Friday. Coinbase Global ($COIN) was an exception here, gaining 6.0% on Tuesday after Bitcoin breached $30,000.

Inflation concerns came up after the Consumer Price Index (CPI) came in for March. Total CPI fell YoY, which was a welcome development, but core-CPI did not. The total Producer Price Index (PPI) and core-PPI fell in March, but the uptick in core-CPI offset some excitement about PPI disinflation.

Also, comments from Fed officials this week indicated that the new inflation readings are not likely to convince the Fed to pause its tightening efforts just yet. Fed Governor Waller (FOMC voter) said on Friday that the Fed hasn’t made much progress on its inflation goal and that he thinks monetary policy needs to be tightened further and remain there for a while.

The data and comments did not change forecasts for the Fed’s May FOMC meeting. According to the CME FedWatch Tool, the fed funds futures market is pricing in a 78% chance of a 25 basis points rate hike.

Q1 earnings season kicked off on Friday with $JPM, $C, $BLK, and $PNC all finishing the day with a gain on a good report. Strength from the financial sector was not enough to carry the market on Friday, though as regional banks were weak on Friday despite gains from their larger peers.

Still, the S&P 500 hit its best level since mid-February. Trading had noticeably light volume this week, which could be attributed to a larger wait-and-see mindset as investors await the bulk of Q1 earnings season.

Only 4 S&P sectors closed with a loss this week — real estate (-1.35%), utilities (-1.32%), information technology (-0.28%), and consumer staples (-0.24%) — while financials (+2.78%) led the outperformers by a decent margin.

Monday:

The stock market looked weak at the open as the main indices fell under the weight of mega cap losses. Even at session lows, though, the broader market showed nice resilience in front of several market-moving data releases later in the week.

The Dow Jones Industrial Average was the strongest of the day, declining just 0.4% at its low for the day, while the tech-heavy Nasdaq saw a loss of 1.3% at its low before settling the day close to flat. Monday’s best performer, however, was the small cap Russell 2000 (+1.0%).

The main indices all improved noticeably when the mega cap stocks started to recover earlier losses. The Vanguard Mega Cap Growth ETF ($MGK) was down as much as 1.6% before closing with a 0.3% loss. This recovery effort helped the market close near its highs for the day, which had the S&P 500 above 4,100.

There was no economic data of note for Monday.

Tuesday:

Tuesday continued the trend of relatively light volume, again showing resilience to selling efforts ahead of big events later in the week.

Some of the mega cap stocks were able to climb off their session lows as the broader market settled into a steady grind higher in the afternoon. The main indices took a sharp turn lower, though, with about 30 minutes left in the session as names like Microsoft (MSFT), Apple (AAPL), and NVIDIA (NVDA) retested early lows.

Coinbase Global (COIN) made an outsized move Tuesday after Bitcoin reached $30,000, Moderna (MRNA) dropped 3.1% following its acknowledgment that its influenza vaccine candidate did not accrue sufficient cases at the interim efficacy analysis to declare early success, and CarMax (KMX) logged a nearly 10% gain after its better than expected fiscal Q4 earnings results.

Again, there was no economic data of note for Tuesday.

Wednesday:

The day started on an upbeat note as investors digested the Consumer Price Index (CPI) for March. The S&P 500 and Nasdaq logged gains of 0.6% and 0.9%, respectively, shortly after the open.

Early gains disappeared, though, as mega cap stocks rolled over and Treasury yields also climbed.

There was a subsequent rebound effort that took root after the S&P 500 dipped below 4,100. The market was moving cautiously forward into the release of the FOMC Minutes from the March 21-22 meeting.

The Minutes revealed that members agreed that inflation remains too high and that the banking problems increased economic uncertainty. Still, all agreed that it was appropriate to raise the target range for the fed funds rate even though the staff economic outlook included a mild recession starting later this year given the potential economic effects of recent banking-sector developments.

Things rolled over again in the late afternoon with mega cap stocks leading the slide.

The selling interest was likely also driven more by valuation concerns rather than a negative reaction to the Fed forecasting a mild recession, in my opinion. The cyclical S&P 500 sectors pulled back along with the rest of the market, but still finished the day in a position of relative strength.

Wednesday’s data included the MBA Mortgage application index and the CPI numbers.

The weekly MBA Mortgage Applications Index rose 5.3% with purchase applications jumping 8.0% while refinance applications were flat.

Total CPI was up 0.1% MoM on February’s increase of 0.4%, 0.3% was expected. Core-CPI, which excludes food and energy, increased 0.4%, as expected, following a 0.5% increase in February. Services inflation was up 0.3% MoM, versus up 0.5% in February, and up 7.3% YoY versus up 7.6% in February. Excluding shelter, services inflation was flat, compared to a 0.1% increase in February, and up 6.1% YoY versus up 6.9% in February. On a YoY basis, total CPI was up 5.0%, versus up 6.0% in February. That is the smallest 12-month increase since May 2021. Core-CPI was up 5.6% year-over-year, versus up 5.5% in February.

The key takeaway from the report is the disinflation seen in March. That trend doesn’t necessarily take a rate hike at the May FOMC meeting off the table, especially with core-CPI tipping slightly higher, but it is fostering a belief that a rate hike in May could be the last hike in the Fed’s tightening cycle.

Thursday:

Thursday was strong and only strong. Gains from the mega cap space gave the main indices a big boost. The positive bias was partially a reaction to the pleasing economic data in the morning and there was likely some short-covering activity contributing too.

The major indices spent most of the session in a steady climb, closing near their best levels of the day. The S&P 500 hit 4,150 at its high of the day, marking its best level since February 15.

By the close, bonds had given back all of their post-PPI, knee-jerk gains to settle the session with losses across the curve. Notably, stocks advanced as bond yields rose from their post-PPI lows, which were set around the time the stock market opened for trading, suggesting perhaps that there was some asset reallocation within the day.

For Thursday, we had the PPI report and Initial unemployment claims.

The Producer Price Index for final demand declined 0.5% MoM in March compared to an expected 0.1% and following an upwardly revised 0.0% reading in February. Excluding food and energy, the index for final demand fell 0.1% MoM. YoY, the index for final demand was up 2.7% versus 4.9% in February. Excluding food and energy, the index for final demand was up 3.4% versus 4.8% in February.

The key takeaway is that producers are seeing some welcome disinflation, aided by declines in energy prices; however, the stickiness of core CPI in March has offset some of the excitement about the improvement in the PPI data in March.

Initial claims for the week ending April 8 increased by 11,000 to 239,000, above expectations by 3,000, and continuing claims for the week ending April 1 decreased by 13,000 to 1.810 million. The key takeaway from this report is that it reflects some softening in the labor market but not any clear-cut weakness.

Friday:

Friday was the big day. Trading sent many stocks lower. The main indices tried to move higher, but quickly fell below their flat lines and remained in the red through the close. Investors were digesting a slate of economic data and corporate news ahead of the open, including some pleasing Q1 earnings results from several large banks.

$JPM, $C, $BLK, and $PNC were among the top performing stocks Friday, driving a 1.1% gain in the S&P 500 financial sector.

While the financial sector was providing support for the broader market, mega cap losses offset much of that support and drove a lot of the index level weakness. Names like $META, $AMZN, $GOOG were able to recover their losses and finish with at least a modest gain. This coincided with the broader market rebounding from its lows of the day.

Investors were also reacting to Fed Governor Waller’s remarks in a speech before the open that the Fed hasn’t made much progress on its inflation goal and that he thinks monetary policy needs to be tightened further and remain tight for a substantial period of time.

Also, some added selling pressure kicked in after the preliminary Consumer Sentiment Index for April showed year-ahead inflation expectations rising to 4.6% from 3.6%.

Economic data for Friday included import and export prices, retail sales, industrial production, and the consumer sentiment index.

Import prices fell 0.6% MoM and were down 4.6% YoY. Excluding fuel, import prices were down 0.5% MoM and down 1.5% YoY. Export prices fell 0.3% MoM and were down 4.8% YoY. Excluding agricultural products, export prices were down 0.2% MoM and were down 5.2% YoY.

Total retail sales fell 1% MoM in March, much lower than the expected -0.4%, and the 0.2% decline in February. Excluding autos, retail sales were down 0.8% MoM. The key takeaway is that sales declines were seen across most retail categories, reflecting weakness in consumer spending on goods that should exacerbate concerns about an economic slowdown that cuts into earnings prospects.

Total industrial production rose 0.4% MoM in March. The capacity utilization rate jumped to 79.8%. The key takeaway from the report is that the entire gain in industrial production in March was driven by the increased output of utilities, which is to say the headline print contradicts an otherwise soft environment for manufacturing output.

The preliminary University of Michigan Consumer Sentiment Index for April was 63.5, above the 62.7 consensus and the final reading of 62.0 for March. YoY, the index stood at 65.2. The key takeaway from the report is that short-run inflation expectations were up noticeably from the prior month, which is something that could compel the Fed to press ahead with another rate hike in May even though long-run inflation expectations remained stable.

That’s it for my recap! If you would like to see how I am building my dividend portfolio using my predictions/strategy written here, you can read about my buys in my weekly portfolio update on this link.

And if you like updates like this, follow my Twitter or my CommonStock page where I post updates on the economic data throughout the week.

Regards,

Dividend Dollars

Categories
Economics Market Recap Market Update Stock Market

Stock Market Recap & Outlook (4/7/23) – A Slow Start to Q2

This weekly market recap is brought to you by Koyfin, a powerful analytical tool that I am proud to partner with. Their platform is entirely customizable for whatever data you want to look at including stocks, ETFs, mutual funds, currencies, economic data releases (one of my personal favorites used often for these posts), crypto, and even transcripts of company events! Click the link above to get a special offer only for Dividend Dollar readers or go give my product review a read if you’re interested!

Dividend Dollars’ Outlook & Opinion

Be careful what you wish for was the theme of this week. The Fed has been telling us for months that labor market deterioration would be needed in order to slow inflation. This is a risky ask as consumer spending accounts for about 2/3s of the US economy, job losses significant enough to dent inflation are likely to lead to a recession.

This week was about as choppy and directionless as we can get. This action tells me that the market is at an inflection point, one where we must decide if bad news is good news (because it might mean the end of the rate hike) or if bad news is bad news (because it might mean a recission is unavoidable0. It may be a while before we have the answer to that question.

Last week, our indicators and thoughts pointed to moderate bullishness with high volatility. At the close of Thursday, the $VIX was $0.42 lower for the week at $18.40. Volatility ended lower, but it was not without it spikes close to $20.00 four times throughout the week. SPX ended slightly lower for the week at 4,105 compared the close last week at 4,109. I’d say the jury is out on whether the forecast was on target or not (I’m thinking not)!

Technically, because of the lack of moves, things haven’t changed much for SPX. It is still about the long term downtrend and all of the significant SMAs. We did break above and then back under the significant 4,100 level.

Remember last week when I said, “Historically, markets tend to switch directions at the beginning of a new quarter and April tends to be a relatively bullish month”? Well the first half of that was true! This week was a definitely a switch away from the strong upward direction we had to end March.

Various indicators have worsened through the course of this week. SPX open interest put call ratios and the volume put call ratio of the major indexes worsened to moderately bearish levels. SPX volume put call ratio worsened to neutral levels from moderately bullish last week. Meanwhile, VIX open interest changed to moderately bullish. Overall, there was not much shifting in the indicators, but they’re just enough to lean a bit more bearish next week compared to this week.

Additionally, the reaction to the march employment report will be felt on Monday, the CPI and PPI follow midweek, and the unofficial start of Q1 earnings season from several banks is certain to bring volatility next week.

Next week appears to be learning bearish via the indicators and technical resistance around the 4,100. Positive data and earnings reports may flip that script.

Weekly Market Review

Summary:

The stock market ended the week slightly down. The Dow Jones Industrial Average squeezed out a slim gain, thanks to money flowing into blue chips, while the major indices made losses due to renewed growth concerns.

There was not a ton of conviction to start the week after OPEC+ surprised markets with a 1.16 million barrels per day production cut announcement. This sent oil prices on a tear, rising 6.4% this week to $80.70/bbl.

Then, growth concerns carried the price action for the remainder of the week. Lingering slowdown concerns were stoked by a slate of weak economic data and a contention by JPMorgan Chase ($JPM) CEO Jamie Dimon in his annual shareholder letter that the regional banking crisis is not over yet and have unseen repercussions for a time.

Many of the economic releases this week came in weaker than expected, adding to the uncertainty surrounding this week.

With an increasing concern of slower growth, investors anticpate further cuts to earnings estimates. Cyclical sectors were the biggest losers this week while defensive-oriented sectors enjoyed nice gains.

The industrials, consumer discretionary , and materials  sectors were the top losers while the utilities  and health care  sectors rose to the top of the leaderboard. The energy sector was another top performer this week despite its economically-sensitive status thanks to the OPEC+ announcement.

Monday:

The stock market kicked off this holiday-shortened week with mixed price action. There was not a lot of conviction in the market except for oil-related trades following the OPEX+ announcement.

The main indices traded in narrow ranges Monday, with the Dow Jones Industrial Average leading throughout the session. The S&P 500 climbed to 4,127 in early action but gave back those gains and then some as it slid to 4,098 before staging an afternoon push that left it close to its high for the day at the close. Nasdaq slumped throughout the day but ended above its lows as mega cap stocks pared larger losses in the late afternoon run.

Tesla ($TSLA) was a notable laggard from the mega cap space, falling more than 6.0% on Monday after reporting Q1 production and delivery numbers.

Economic data for Monday had the Manufacturing PMI, ISM manufacturing index reading, and Construction Spending update.

The March IHS Markit Manufacturing PMI fell to 49.2 from 49.3.

The March ISM Manufacturing Index fell to 46.3% (Briefing.com consensus 47.5%) from 47.7% in February, the consensus was 47.5%. This is the lowest reading since May 2020. The line between expansion and contraction is 50.0%, so the sub-50.0% reading for March reflects a general contraction in manufacturing activity for the 5th straight month. The ISM says this level corresponds to a change of -0.9% in real GDP on an annualized basis based on the past relationship of the PMI and the overall economy.

Total construction spending declined 0.1% MoM in February, compared to flat expectations. Total private construction was flat MoM while total public construction fell 0.2% MoM. On a YoY basis, total construction spending was up 5.2%. New single-family construction remained a weak spot, as higher interest rates and increased building costs make financing expensive at a time when concerns about a future economic slowdown/contraction are taking root.

Tuesday:

The Dow Jones Industrial Average, Nasdaq Composite, and S&P 500 hit modest losses on Tuesday as the resistance to Monday’s selling efforts dissipated. Initially, the main indices all moved higher, but gains quickly faded and the market traded near its worst levels for most of the session. The S&P 500 was able to close right on top of the 4,100 level thanks to a last minute move higher.

Banks stocks came under some added selling pressure, undercut by economic slowdown concerns that followed the day’s weaker than expected economic data and a stark warning by JPMorgan Chase (JPM) CEO Jamie Dimon’s annual letter.

In addition to the financial sector, other cyclical sectors felt the pinch of slowdown concerns and underperformed Tuesday, while defensive areas received modest gains.

Still, the S&P 500 held up okay Tuesday despite being overbought on a short-term basis following big gains in Q1. Losses would have been more pronounced if not for gains in a few heavily-weighted stocks.

Additionally, Finland has joined NATO as the 31st member through a swift addition that began in response to Russia’s invasion of Ukraine. “What we see is that President Putin went to war against Ukraine with a declared aim to get less NATO,” Jens Stoltenberg, NATO Chief, told reporters. “He’s getting the exact opposite.” Following the announcement, Russia claims it will bolster their border defenses.

As for economic data, we received the Factory orders report and the JOLTS job openings report.

Factory orders fell 0.7% MoM in February, compared to an expected 0.5% fall. This follows a downwardly revised 2.1% decline in January. Shipments of manufactured goods fell 0.5% MoM after increasing 0.3% in January. This report is backward looking, yet it fits the understanding that manufacturing conditions have weakened, evidenced by the more current March ISM Manufacturing Index which was lackluster on Monday.

The JOLTS report showed that job openings totaled 9.931 million in February following a downwardly revised count of 10.563 million in January.This was the first reading below 10 million since May 2021.

Wednesday:

The stock market had a weak showing Wednesday. Blue chip names continued to get bought while more economically-sensitive sectors logged decent losses following another batch of weak economic data Wednesday morning.

the ADP Employment Change for March was weaker than expected, the February trade deficit widened more than, and the March ISM Non-Manufacturing Index was weaker than expected.

Buying interest for Treasuries picked up following the data releases. Stocks didn’t respond positively to the drop in market rates due to a sense that a weaker economy will translate into further cuts to earnings estimates.

The main indices spent most of the morning in a slow grind lower, but climbed above their worst levels of the day by close. Nasdaq fared the worse while the Dow Jones Industrial Average squeezed out a slim gain, benefitting from blue chip favoritism, with big wins by $UNH and $JNJ for the day.

Shares of Johnson & Johnson moved on news that its subsidiary LTL Management re-filed for voluntary Chapter 11 bankruptcy protection to resolve claims from cosmetic talc litigation and will pay an $8.9 billion settlement, while UnitedHealth surged on an upgrade to Strong Buy from Raymond James.

Data for Wednesday included the ADP employment report, the February Trade Balance Report, the IHS Services PMI, and the ISM non-manufacturing index.

The ADP Employment Change Report for March showed private sector employment increasing by 145,000 compared to a 205,000 expectation. Interestingly, Services Hiring surrounding financial activities and business services fell the most this reading. Weak pockets included manufacturing (-30,000), financial activities (-51,000), professional/business services (-46,000), and information (-7,000).

The February Trade Balance Report showed a growing trade deficit to $70.5 billion from a downwardly revised $68.7 billion in January. Exports were $6.9 billion less than January exports and imports were $5.0 billion less than January imports. The decline in both exports and imports is reflective of a slowdown in global trade activity.

The March IHS Markit Services PMI fell to 52.6 in the final reading from 53.8. The ISM Non-Manufacturing Index for March dropped to 51.2% from 55.1% in February. Again, line between expansion and contraction is 50.0%, so the March reading reflects continued growth in the services sector, but at a slower pace than the prior month. Activity in our economy’s largest sector is slowing noticeably with a cooling off in the new orders growth rate. The slowdown in activity and improved supply chain dynamics, though, have helped temper the pace of price increases for services.

Thursday:

The last day of this holiday-shortened week started on a softer note as investors digested another weak economic release. Things improved considerably around mid-morning thanks to some mega cap stocks staging a strong recovery from their lows.

The main indices all closed near their best levels on Thursday, but on below-average volume. Despite Thursday’s gains, growth concerns that drove price action in recent sessions did not fade as seen by the underperformance of economically-sensitive sectors.

The energy (-1.5%), materials (-0.2%), and industrials (-0.03%) sectors were the lone laggards to close in the red. On the flip side, the communication services (+1.7%) and information technology (+0.7%) sectors were among the best performers, thanks to gains in their respective mega caps. Other notable outperformers were the utilities (+0.7%) and real estate (+0.7%) sectors.

Economic data for the day was primarily the weekly initial claims reading.

Claims came in at 228K and the last reading was revised to 246K from 198K. Weekly Continuing Claims also saw a slight increase to 1.823 million from the upwardly revised 1.817 million in the last reading. The report featured a revision to the seasonal adjustment factor, which resulted in big upward moves to figures from recent weeks. This is a big miss as far as these reports are concerned. That said, the higher level of claims will invite some questions about the strength of the labor market after last week’s release of the Job Openings and Labor Turnover survey for February showed a big drop in openings.

Friday:

Happy Good Friday yall! Enjoy your weekend and happy holidays!

That’s it for my recap! If you would like to see how I am building my dividend portfolio using my predictions/strategy written here, you can read about my buys in my weekly portfolio update on this link.

And if you like updates like this, follow my Twitter or my CommonStock page where I post updates on the economic data throughout the week.

Regards,

Dividend Dollars

Categories
Economics Market Recap Market Update Stock Market

Stock Market Recap & Outlook (3/31/23) – Q1 2023 Ends With A Bang

This weekly market recap is brought to you by Koyfin, a powerful analytical tool that I am proud to partner with. Their platform is entirely customizable for whatever data you want to look at including stocks, ETFs, mutual funds, currencies, economic data releases (one of my personal favorites used often for these posts), crypto, and even transcripts of company events! Click the link above to get a special offer only for Dividend Dollar readers or go give my product review a read if you’re interested!

Dividend Dollars’ Outlook & Opinion

I’m switching it up this week and putting the outlook first as I believe the outlook content is more pertinent for the following weeks than a recap of historical information. The best information should always be at the top, right?!

Anyways, this was a light week for economic data. The most important figure, in my opinion, was the core PCE. This is the Fed’s preferred inflation gauge. While the reading’s MoM increase was exactly on target, the YoY level was +4.6%, just below the estimate and prior month’s reading at +4.7%. Like the other inflation metrics, this figure has been falling steadily for several months now. The takeaway here is that prices are not falling, however, they are rising at a slower rate. This is good news.

When this quarter began, you could probably count the number of bullish analysts on one hand. Objectively, it was not a great quarter, however, following a 19.4% decline in 2022, total rate hikes of 50 basis points, two significant bank failures and touching negative territory two weeks ago to finish the quarter up over 6% is wild.

With this rally to end the month, SPX is now higher than the long-term downtrend by the largest margin to date. SPX finished the week well above all significant moving averages, and inched above the 4,100 technical resistance level with some fast moves at the end of Friday.

Historically, markets tend to switch directions at the beginning of a new quarter and April tends to be a relatively bullish month. However, nearly missing a major banking crisis is still in the back of the market’s mind and the start of a potentially weak Q1 earnings season around the corner, it’s too early to tell if history will repeat itself.

Various indicators have improved and worsened through the course of this week. VIX and SPX open interest put call ratios improved into neutral territory, VIX and SPX open interest changes improved to moderately bullish levels. Meanwhile, major ETF and equity changes in open interest, and VIX implied volatility gaps have worsened to moderately bullish, neutral, and neutral territory, respectively.

In general, things are looking moderately bullish. There are a few more upgrades than downgrades this week, but some items contradict others, indicating increased volatility. With the next potential rate hike will not arrive till May, earnings season kicks off in a few weeks, and a dodged financial crisis looming over shoulders, traders may look to continue the buying spree, but not without some volatility.

Weekly Market Review

Summary:

Q1 2023 ended with a bang. The S&P 500 spent most of the week above its 50-day moving average and the 4,100 level by Friday’s close. The indices stuck to a narrow range in the first half of the week, though, as investors continued to digest all the bank happenings of prior weeks.

Participants reacted favorably to news that First Citizens Bancshares ($FCNCA) will acquire some of Silicon Valley Bank’s and that authorities are considering expanding an emergency lending facility for banks. Bank stocks remained under pressure though. FDIC Chairman Michael Barr told the Senate Banking Committee that he sees needing to increase capital and liquidity standards for firms over $100 billion.

Overall, the S&P 500 financial sector rose 3.7% this week, but it declined 6.1% in Q1.

Some of the gains this week were pushed by strong leadership from semiconductor stocks. The iShares Semiconductor Index ($SOXX) rose 3.17% this week and surged 25.6% this quarter. The market liked Micron’s ($MU) earnings report, but prices fell back down on Friday due to reports that Chinese regulators are reviewing their products for security.

The rally charged ahead on Friday from relatively pleasing inflation data. The PCE Price Index slowed to 5.0% YoY in February from 5.3% in January. The core-PCE Price Index hit 4.6% from 4.7%. The direction of these moves is good news, but the pace of decreases could improve.

The U.S. Dollar Index fell 0.6% to 102.52. On that note, China and Brazil agreed to trade in their own currencies instead of the USD.

All 11 S&P 500 sectors ended the week green. Energy (+6.3%), consumer discretionary (+5.6%), and real estate (+5.2%) lead while communication services (+2.3%) and health care (+1.7%) trailed.

Monday:

The market started the day mixed. Sentiment around the bank sector shifted after investors learned that First Citizens Bancshares ($FCNCA) will acquire $72 bln of Silicon Valley Bank’s assets at a discount of $16.50 bln.

Additionally, a Bloomberg report indicated that US authorities are considering expanding an emergency lending facility for banks in ways that would give First Republic Bank ($FRC) more time to improve its balance sheet.

Despite the banking improvements, major indices closed mixed with NASDAQ trailing. They were feeling the weight of lagging mega cap stocks, which helped drive a 0.7% loss in the Vanguard Mega Cap Growth ETF ($MGK) versus a 0.7% gain in the Invesco S&P 500 Equal Weight ETF ($RSP).

There was no economic data of note on Monday.

Tuesday:

Markets were in relatively tight range on below average volume. Indices closed red after climbing above their worst levels in the afternoon. The Nasdaq trailed its peers again Tuesday, weighed down by lagging mega cap stocks.

Morning money flows looked somewhat similar to Monday’s with banks leading. Sentiment seemed to shift around the time that FDIC Chairman Michael Barr testified at Senate Banking Committee, suggesting more regulation.

Economic data for Tuesday contained the international trade in goods, the FHFA housing price index, and the consumer confidence reading.

The advanced report for international trade in goods showed a $91.6 billion deficit in February versus a $91.1 billion deficit in January. Retail inventories reflected a 0.8% build following a 0.1% from the prior. Wholesale inventories showed a 0.2% build after a 0.5% decline in January.

The FHFA Housing Price Index rose 0.2% in January following a 0.1% drop in December.

The Conference Board’s Consumer Confidence Index for March hit 104.2 above the expected 101.5 versus the 103.4 reading for February. Last year, the index was at 107.6.

The key here is that this survey included the period included the SVB fiasco and still help up well. However, the Expectations Index remained below 80 level for the 12th month out of the last 13, which serves as a concerning signal about future growth.

Wednesday:

Wednesday was a positive day following the 2-day Congressional hearing on the SVB bank failure. For most of the day, the main indices chopped around a range, albeit sporting nice gains. A late afternoon push higher had the main indices close near their highs of the day, leaving the S&P 500 above its 50-day moving average.

Nasdaq led thanks to strong mega caps and chipmakers. Micron’s ($MU) quarterly results pleased, and many semi stocks traded up with it.

Semi strength helped drive a 2.1% gain in the S&P 500 information technology sector, which closed near the top of the leaderboard of sectors.

Economic data for Wednesday included the MBA mortgage index and the pending home sales report.

The weekly MBA Mortgage Applications Index rose 2.9% with purchase application jumping 2.0% (-35% YoY) with refinancing applications rising 5.0% (-61% YoY). Improvements are being made, activity is still at historical lows.

Pending home sales rose 0.8% in February versus an expected 2.3% drop. This is coming off of the 8.1% increase from January.

Thursday:

At first, the main indices all logged decent gains led by the Nasdaq thanks to relative strength from chipmakers and mega cap stocks.

This faded and the main indices slowly fell, hitting their session lows around midday. The downturn was attributed to renewed selling pressure in bank stocks, indicating that concerns about additional fallout remain in play. The S&P 500 financial sector (-0.3%) was the worst performer for the day.

After the slump, the main indices bounced and closed near highs of the day. The S&P 500 was able to extend even higher above its 50-day moving average.

Economic data for Thursday included the initial jobless claims report and the Q4 2022 GDP estimate.

Initial jobless claims for the week ending March 25 rose 7,000 to 198,000 while continuing jobless claims for the week ending March 18 rose 4,000 to 1.689 million.

The key takeaway from the report is that claims remain at a stable level near the 200,000 mark, suggesting little recent stress in the labor market.

The third estimate for Q4 GDP showed a small downward revision to 2.6% from 2.7% reported in the second estimate. The drop was due decreases to exports and consumer spending. The personal consumption expenditures index was flat at 3.7% while the core-PCE Price Index was revised up to 4.4% from 4.3%. The GDP Price Deflator was left flat at 3.9%.

The key takeaway from the report is that it continues to show decent growth while inflation remains above the 2% target, which the Fed could use as an argument for additional rate hikes.

Friday:

The market ended Q1 with great gains. The indices moved up right out of the gate and spent most of the day trending higher. A sharp jump higher in the late afternoon had the S&P 500 close above the 4,100 level.

The run followed some pleasing inflation and consumer sentiment data in the morning.

Strength from the mega cap space pushed index levels high on Friday and throughout the quarter in genera. The Vanguard Mega Cap Growth ETF ($MGK) rose 1.8% versus a 1.5% gain in the Invesco S&P 500 Equal Weight ETF ($RSP) and a 1.4% gain in the market-cap weighted S&P 500. $MGK rose 18.9% this quarter versus a 2.4% gain in the $RSP.

Friday’s economic data included the PCE reading and the Michigan Consumer Sentiment Survey.

February Personal Income increased 0.3% while spending only increased 0.2%. February PCE Prices and Core PCE prices rose 0.3% with core PCE Prices.

The key takeaway from the report is that it only showed a slight deceleration in the YoY PCE and core-PCE price indices. Though things are moving in the right direction, one can argue the Fed still has room to raise rates.

The March Univ. of Michigan Consumer Sentiment hit 62, down from 63.4 in the prior.

The key here is similar to the other reading we saw, sentiment was relatively strong considering the SVB situation occurred during the survey period.

That’s it for my recap! If you would like to see how I am building my dividend portfolio using my predictions/strategy written here, you can read about my buys in my weekly portfolio update on this link.

And if you like updates like this, follow my Twitter or my CommonStock page where I post updates on the economic data throughout the week.

Regards,

Dividend Dollars

Categories
Dividend Stocks Dividends Portfolio Stock Market

Dividend Portfolio: 3/31/23 Weekly Update

Welcome back to the weekly Dividend Dollars portfolio review!

This portfolio update is brought to you by Sharesight, a portfolio tracking tool that I am happy to partner with. Their platform makes tracking trading and dividend history, understanding your performance, and saving time a breeze. I wrote a review of the product that you can read here if you’re interested in learning more! Click the link above or the picture below to get a special offer only for Dividend Dollar readers!

Here at Dividend Dollars, our investing approach is a dividend growth strategy with aspects of value investing and fundamental analysis. I am a young investor in my 20’s and by sticking to this strategy over the long term, the magical powers of compounding are on my side. This allows me to more easily build substantial positions in dividend paying stocks over time, which will one day help me reach the ultimate goal of being financially free through the sources of passive income they provide. You can read more about the strategy here. Let’s dive into the portfolio review!

Portfolio Value

To date, I have invested $15,050 into the account the total value of all positions plus any cash on hand is $15,453.30. That’s a total gain of 2.68%. The account is up $516.46 for the week which is a 3.46% gain.

We started building this portfolio on 9/24/2021 and when compared to the S&P 500 we are outperforming the market so far! Within that same timeframe, the S&P 500 is down -7.777% which puts us 10.45% higher than the market! I love tracking my portfolio against a benchmark like the S&P. The above chart comes from Sharesight which makes portfolio and dividend management a breeze!

We added $120 in cash to the account last week, trades made will be broken out below.

Portfolio

Above is a dashboard of the portfolio that tracks annual dividend income, yield, beta, dividend growth, and more.

Below is a table of everything we are invested in so far. There you can see my number of shares, shares bought through dividend reinvestments, average cost, gains, and more. The tickers in green are positions that I bought shares in this week, the blue ones are positions that I reinvested dividends into, the yellow ones are positions that announced a dividend increase this week, and the red are positions that I trimmed. Our PADI increased from $630 to $635.

Dividends

This I received $21.14 from four dividends ($AY, $SCHD, and $XYLG).

In my portfolio, all positions have dividend reinvestment enabled. I don’t hold onto the dividend, I don’t try to time the reinvestment, I just let my broker do it automatically. All four of these dividends were received after close on Friday and will be reinvested on Monday.

Dividends received for 2023: $133.88

Portfolio’s Lifetime Dividends: $544.28

Trades

This week was not too busy for me. The market was on quite the run to end the quarter. I personally think some more downside is coming later this year, so taking a couple conservative weeks like this won’t hurt me in the long run. We took 91%  gains on the $NYCB covered call, reinvested all dividends, picked up some $CMCSA for the next dividend, and added more into $SMHB due to the continued small cap weaknesses.

Full details for my trades are below:

  • March 27th, 2023
    • Bought to Close $NYCB Covered Call – $11 strike, 4/21 expiration for $1, $10 gain
    • Atlantica Sustainable Infrastructure ($AY) – $5.74 dividend reinvested
    • Schwab US Dividend Equity ETF ($SCHD) – $6.22 dividend reinvested
  • March 28th, 2023
    • Comcast ($CMCSA) – added 1 share at $36.69
    • ETRACS 2xMonthly Pay Levered ETN ($SMHB) – added 2 shares at $5.03
  • March 29th, 2023
    • Global X S&P 500 Covered Call & Growth ($XYLG) – $4.41 dividend reinvested

Next week I will look to continue my weekly buys into $SPY, $SCHD, and $XYLG (which I haven’t been doing a good job of), and watch for more opportunities to add into $CMCSA and $INTC as those are my next ex dividend dates for red positions.

Summary

That is it for the update this week. The market recap and outlook will be posted later this week and provides tons of information on what macro statistics I look at to keep a temperature gauge on the market and inform my portfolio movements. Read last week’s here while you wait for the new one!

Let me know what you think of the progress so far, share with me your progress and questions, interact with me on Twitter and CommonStock and other socials using the links below!

Thank you for reading! See you next week and stay safe!

Regards,

Dividend Dollars