Categories
Economics Market Recap Market Update Stock Market

Stock Market Recap & Outlook (3/24/23) – Fed Hikes Rates Again and Banks Recoup

This weekly market recap is brought to you by Koyfin, a powerful analytical tool that I am proud to partner with. Their platform is entirely customizable for whatever data you want to look at including stocks, ETFs, mutual funds, currencies, economic data releases (one of my personal favorites used often for these posts), crypto, and even transcripts of company events! Click the link above to get a special offer only for Dividend Dollar readers or go give my product review a read if you’re interested!

Weekly Market Review

Summary:

This week was a volatile one, mostly in the middle of the week, leaving the first and last days ending pretty firmly in place.

Over the weekend, we got news that the Swiss National Bank brokered a UBS ($UBS) acquisition of Credit Suisse ($CS) for a price of $3.2 billion. The Federal Reserve also announced coordinated action with the Bank of Canada, the Bank of England, the Bank of Japan, the European Central Bank, and the Swiss National Bank to enhance US dollar liquidity and assure that “the capital and liquidity positions of the US banking system are strong, and the US financial system is resilient.”

Early in the week, we received Treasury Secretary Yellen’s remark for the American Bankers Association that the government is prepared to intervene again “if smaller institutions suffer deposit runs that pose the risk of contagion.”

Many of the beat-up bank stocks moved higher in the first half of the week as we awaited the FOMC decision on Wednesday, which brought sharp declines at the index level that day.

The FOMC voted unanimously to raise the target range for the fed funds rate by 25 basis points to 4.75-5.00% and the updated Summary of Economic Projections showed the Fed’s median terminal rate of 5.10%. Stocks initially ran on this news before flipping lower as Fed Chair Powell gave his press conference.

Powell acknowledged that the Fed does not anticipate rate cuts this year. He believes that the events in the banking system do not help the possibility of a soft landing for the economy.

All together, Powell was neither super hawkish nor dovish. He did not sound particularly confident in the outlook either.

More central banks followed later in the week. The Bank of England announced a 25-bps hike and hinted at more increases in the future while central banks from Switzerland, Norway, Hong Kong, and Philippines also raise their rates.

By the end of Friday, price action suggested that the market had shaken off some of these concerns. The main indices closed the higher despite sharp declines in Europe’s indices.

The Treasury market was also volatile this week. Ultimately, the 2-yr note yield fell 5 basis points this week to 3.77% and the 10-yr note yield fell 2 basis points to 3.38%.

Only 2 S&P 500 sectors finished the week red– real estate ($XLRE -1.99%) and utilities ( $XLU -1.91%) — while the communication services (+3.4%), energy (+2.3%), and information technology (+2.0%) sectors saw the biggest gains.

Monday:

The stock market kicked off the new week with a reversal from the end of last week. Banks showed nice strength on the news over the weekend of the Credit Suisse acquisition.

Additionally, the Federal Reserve announced the coordinated central bank action enhance the USD assure that “the capital and liquidity positions of the US banking system are strong, and the US financial system is resilient.”

Still, some concerns around the banking industry persist, as seen in the decline of First Republic Bank ($FRC). The SPDR S&P Bank ETF ($KBE), which was up 4.5% at its high Monday morning, closed with a smaller 1.6% gain and the SPDR S&P Regional Bank ETF ($KRE), which was up 4.9% at its best level of the day, was up 1.2% by the close.

$FRC’s debt was downgraded at S&P to B+ from BB+. There was some minor easing as there were rumors that Jaime Dimon was leading talks with other banks to convert $FRC deposits into a capitl infusion, however, FRC closed near its worst levels of the day.

There was no major economic data releases on Monday.

Tuesday:

The stock market continued strength on Tuesday after Monday had closed above its 200 day SMA. With Tuesday’s move, the S&P 500 regained all the ground that had been lost since March 8 when the SVB Financial blowup started to hit the scene.

Banking stocks led the charge after a Bloomberg report indicated the Treasury Department is looking at ways to guarantee all bank deposits without congressional approval.

Some of the names that had suffered the steepest losses traded up Tuesday. The SPDR S&P Bank ETF ($KBE) rose 5.3% and the SPDR S&P Regional Banking ETF ($KRE) rose 5.8%.

The S&P 500 pushed above its March 8 close after the start of trading before pulling back some and trading in a narrow range throughout most of the session until a late afternoon lift had the indices close near their best levels of the day. The S&P 500 closed above the 4,000 level to lead into the FOMC’s rate hike decision the next day

For economic data on Tuesday we received the home sales reading.

Existing home sales jump 14.5% MoM in February to a seasonally adjusted annual rate of 4.58 million versus an unrevised 4 million in January. Sales increased on a MoM basis in February for the first time in 13 months. Total sales in February were down 22.6% from a year ago.

The key takeaway here is that the median selling price fell for the first time in 11 years, underscoring the affordability challenges caused by rising mortgage rates and prospective buyers’ concerns about making a purchase at the top of the cycle.

Wednesday:

The majority of Wednesday was chop while we waited for FOMC policy decision and Fed Chair Powell’s press conference. The main indices ultimately closed the session sharply lower.

The FOMC voted unanimously to raise rates by 25 basis points. The language of the meeting and the Summary of Economic Projections looked as if the Fed is going to entertain the idea of pausing its rate hikes soon.

That view prompted a knee-jerk reaction upward in stocks the release. However, this sentiment flipped as Powell was speaking. Broad based selling interest came in and crushed last hour of the day.

All together, Mr. Powell did not sound especially hawkish or dovish. Importantly though, he did not sound particularly confident in the outlook either and I suspect that lack of confidence played a part in the lack of confidence that led to the selling during his presentation.

For Wednesday’s economic data we had the Weekly MBA mortgage application index and the Weekly EIA Crude Oil Inventories.

The MBA index rose 3% with refinancing applications growing by 5% and purchase applications rising 2%. The oil inventories showed a draw of 1.06 million barrels following a build of 1.55 million.

Thursday:

The market started strong, recovering some of the sharp declines from Wednesday. The upside momentum started to fade, though, after the S&P 500 briefly tipped above the 4,000 level at its high for the day.

The markets remained green until an uptick in selling interest dragged it into negative territory in the late afternoon. Ultimately, the main indices closed in the green, but far off their highs for day.

Investors were still digesting the Fed’s latest rate hike and commentary from Fed Chair Powell on Thursday along with multiple rate hikes from central banks overseas.

Initially, buying interest was broad with mega cap stocks in a leading position. By the close, most mega cap stocks stayed strong while the broader market deteriorated. The Vanguard Mega Cap Growth ETF ($MGK) was up 1.1% versus a 0.3% decline in the Invesco S&P 500 Equal Weight ETF ($RSP).

For economic data on Thursday, we received the Initial jobless claims report for the week, the Q4 current account balance, and the new home sales report.

The initial jobless claims report for the week ended March 18th fell by 1,000 to 191,000 compared to a 204,000 consensus, while the continuing jobless claims for the week ending March 11ths increased by 14,000 to 1.694 million versus consensus of 1.684 million. The takeaway here is that initial claims remain low, pointing to little change in the health of the labor market, something that the Fed is watching closely.

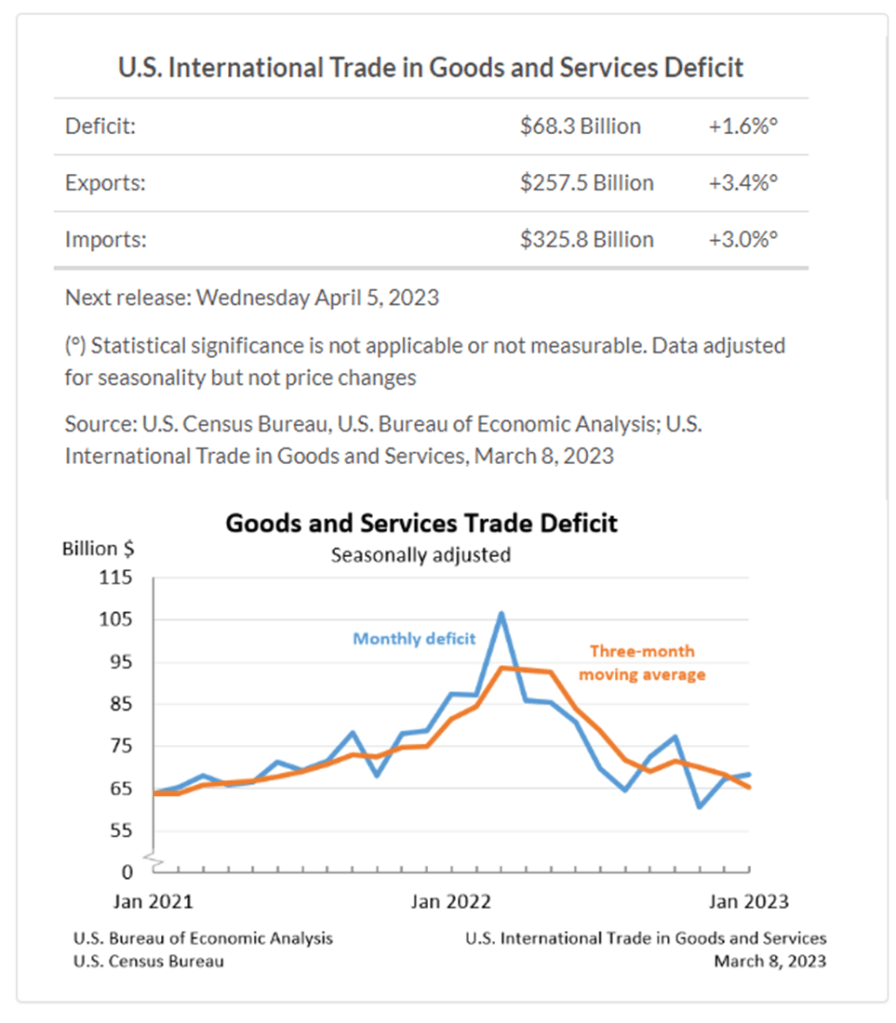
The Q4 current account balance rose to -$208.6 billion from -$219 billion.

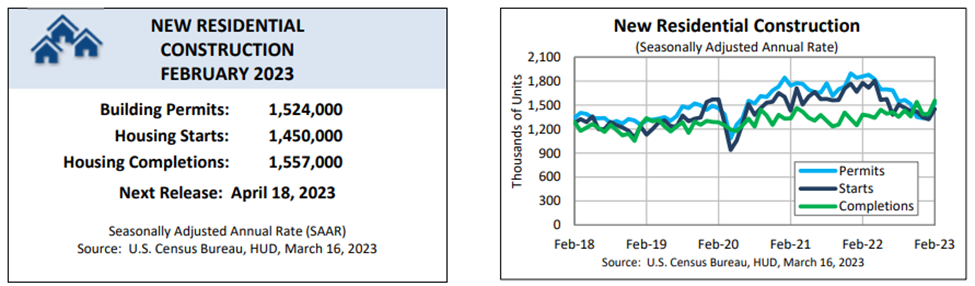
New home sales increased 1.1% MoM in February to an annual rate of 640,000 units from 633,000 in January. On a year-over-year basis new home sales were down 19%. The takeaway here is that sales has moved up for the 4th time in the last 5 months.

Friday:

The stock market closed out the week on an upbeat note, but things didn’t start out that way. Initially, investors were weighing concerns about the banking industry, again, after reports indicated that Deutsche Bank’s ($DB) cost of default insurance jumped to a four-year high.

German Chancellor Scholz and European Central Bank President Lagarde both attempted to calm markets after the news, but stocks were still under pressure despite their efforts. The S&P 500, which fell below its 200-day moving average after the open, was down 1.0% and hit 3,909 at its low for the day. The Nasdaq and Dow were down 1.0% and 0.9% at their lows for the day.

The tone in the market shifted around the time that European markets closed. The tonal shift also coincided with buying interest in the Treasury market subsiding.

Many stocks moved higher with Friday’s rally, which saw the S&P 500 close above its 200-day moving average. The Invesco S&P 500 Equal Weight ETF ($RSP) was up 0.9% while the market-cap weighted S&P 500 had a gain of 0.6%.

Economic data for Friday included the Durable goods orders and the IHS Markit Services PMI.

Durable goods orders fell 1% MoM in February versus an expected 1.6%. Excluding transportation, durable goods orders were flat MoM following a downward revised 0.4% increase form 0.7% in January. The key takeaway is that the report could bring in questions about the strength of the manufacturing sector since it showed an unexpected decline in orders while the January numbers were also revised lower.

The IHS Markit Services PMI rose to 58.3 in the early March reading versus 50.6 in the last reading. The manufacturing PMI rose to 49.3 versus 47.3 last time.

Dividend Dollars’ Outlook & Opinion

That’s it for the recap. Now for my opinion!

This was a slightly last week for economic data with the exception of the FOMC rate decision. Initial jobless claims came in lower than expected. Claims have been averaging below 200k for nine straight weeks, showing that the labor market is still very strong, which gives the Fed more ammo in terms of potential continued rate hikes.

The rate hike this week was the 9th consecutive hike since tightening began 12 months ago, for a total of 4.75% in increases. The Fed’s balance sheet reduction continues at $9B per month. This lead to another volatile week in the Treasury market and the stock market.

Right before the hike was announced, the probability of this weeks 0.25% hike was at 82%. For the 8 years in which data is available, whenever the probability exceeds 65% going into a Fed meeting, the expected move has occurred. Currently, Fed funds futures are pricing in a very little change of another hike in May and very high probability of a cut in June, despite the fact the Fed said they wouldn’t cut rates this year.

Futures and bond markets indicate otherwise. Time will tell if it is right and if the banking sector scare will force a premature pivot from the Fed.

This week was heavy with economic data (two key inflation reports) and plenty of banking news to keep up with. Though both inflation reports were not negative, both were overshadowed by investor anxiety related to banking.

However, given all of this uncertainty, markets moved slightly higher this week as we had expected in the last market outlook.

Our outlook last week a slightly bullish, yet volatile overall. With SPX up on the early days of Monday and Tuesday, then down Wednesday and Thursday, with gains made again on Friday, I would say we were spot on.

SPX managed to close above the 100 and 200 day SMAs on Friday, though it does show struggles around the 100 day SMA. If it can remain above the 100 day SMA, the 50 day SMA is a not-so-distant test of strength.

Changes in ETF open interest and equity open interest lean moderately bullish in the near term while SPX open interest changes are slightly bearish. VIX and SPX volume open interest put call ratios have shifted more bearish this week.

CBOE and OCC volume put call ratios have been oscillating. They aren’t clear if they are shifting more bullish or bearish and should be taken as an indication of volatility in the near term.

Vix futures and the IV gap are relatively neutral if not slightly bearish.

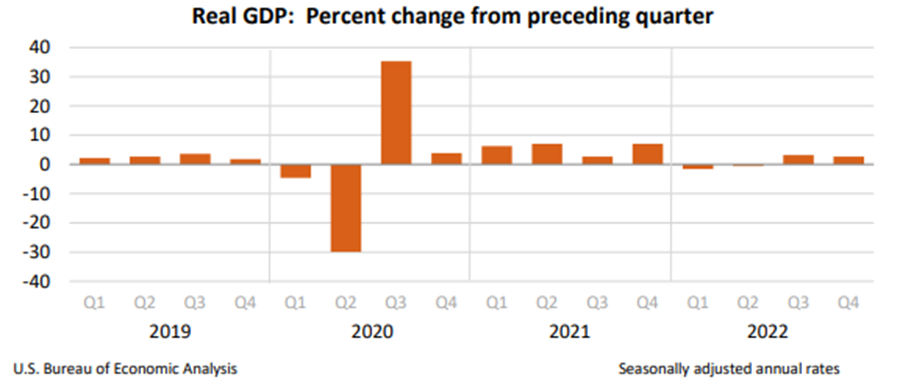
Next week we have the Q4 GDP reading on Thursday and the Core PCE (the Fed’s preferred inflation measure) on Friday to anticipate.

All of these things point to no clear directional bias, so the only logical outlook for next week is just continued volatility. I personally think we see some more green, but the chart and indicators are not clear in direction in my opinion.

That’s it for my recap! If you would like to see how I am building my dividend portfolio using my predictions/strategy written here, you can read about my buys in my weekly portfolio update on this link.

And if you like updates like this, follow my Twitter or my CommonStock page where I post updates on the economic data throughout the week.

Regards,

Dividend Dollars

Categories
Economics Market Recap Market Update Stock Market

Stock Market Recap & Outlook (3/17/23) – Continued Banking Concerns Amongst Surprising Strength

This weekly market recap is brought to you by Koyfin, a powerful analytical tool that I am proud to partner with. Their platform is entirely customizable for whatever data you want to look at including stocks, ETFs, mutual funds, currencies, economic data releases (one of my personal favorites used often for these posts), crypto, and even transcripts of company events! Click the link above to get a special offer only for Dividend Dollar readers or go give my product review a read if you’re interested!

Weekly Market Review

Summary:

Banking scares that surfaced late last week continued to worry investors throughout this week. Continued developments of the situation and actions form the Fed, Treasury, and FDIC kept us all on our toes. Those actions were designed to shore up confidence in the banking industry, but price action did not reflect that.

With investors lacking confidence, a risk-off mentality was behind most price action this week. Certain mega-caps viewed as distant from the banking fallout were bought hand-over-fist. Companies with strong balance sheets and perceived recession resiliency, like $GOOG, $NVDA (sorry TagTrades), and $MSFT. These stocks all gained more than 12% this week.

$MGK, the mega-cap growth ETF from Vanguard was up over 5% this week, helping to prop up returns for the main indexes despite an otherwise weak market.

A flight to safety also showed itself through an outperformance of defensive sectors like utilities (up over 3%), consumer staples, and health care sectors (both up over 1%).

Treasury note yields tanked this week, driven by a belief that the Fed won’t be able to raise rates as much as previously thought in lieu of the banking issues. However, the CME FedWatch Tool shows a 59% probability of 25 basis point hike at the next meeting, and a 52% of another 25 basis point hike at the May meeting after that.

Meanwhile, the European Central Bank agreed to raise its rate by 50 basis points this week despite concern surrounding Credit Suisse ($CS)

Monday:

Monday started a volatile week for us after a busy weekend of banking sector news. The market learned through a joint statement from the FDIC, Treasury, and Fed Market that all depositors at Silicon Valley Bank and Signature Bank of New York would be fully protected even though both had been taken over by regulators.

he Fed also introduced a Bank Term Funding Program that will help banks avoid selling government securities at a loss by allowing them to pledge those securities to the Fed, which will value them at par, as collateral.

These items together makes it so that all depositors would not lose money and that banks would have a different avenue to raise liquidity through the BTFP rather than selling assets at a loss like $SVB did. Smart moves, in my opinion, however they did not calm the stock markets. In fact, their approach created a feeling that this banking issues is larger than we initially thought.

Regional Banking ETF $KRE fell another 12% and SPDR S&P Bank ETF %KBE fell another 10% with the biggest individual losers being $FRC, $WAL, $CMA, and $PACW.

Still, the main indices spent a good portion of the session in positive territory thanks to gains in mega-caps as stated in the summary.

Treasury yields declined as a potential less aggressive Fed is priced in due to this bank fallout and the potential for it to have a disinflationary impact on the economy.

Tuesday:

Stocks opened higher, bolstered by strength in the bank stocks and a small measure of relief that the February Consumer Price Index (CPI) wasn’t much worse than feared.

The quickly oversold market brought some opportunistic trading moves. The S&P 500 would climb as much as 2.1% to 3,937 before stalling at the test of its 200-day moving average (3,939).

Treasuries were selling off with some of the safety premium they had enjoyed in recent sessions being drained away and CPI data influencing prices. 

The rebound momentum reversed after failing to break through its 200-day moving average. Bank stocks began to pull back due to a report from the S&P that they had put $FRC on a credit watchlist shortly after Moody’s had downgraded the US banking system to Negative from Stable.

The day looked to end poorly excepted for a large buying effort in the last 45 minutes of the day that left major indices ending on an upbeat note.

Data on Tuesday was the CPI release and the NFIB Optimism Index.

Total CPI was up 0.4% MoM in February, in line with expectations, and up 6% YoY. This was the smallest 12-month increase since September 2021. Core CPI was up 0.5% MoM against a consensus of 0.4%. The key takeaway from the report was that inflation is still (no surprise here) well above the 2% target. Banking problems have mainly taken a 50 point hike off of the table of the next meeting, this CPI reading definitely keeps a 25 point hike as a possibility. Not raising rates may signal that the banking issues are bigger than people think, so the Fed must tread carefully here.

The February NFIB Small Business Optimism Index had a slight increase to 90.9 from 90.3 last month.

Wednesday:

Cautious trading was back in play. Selling interest on financials picked up after Credit Suisse’s ($CS) largest shareholder said they can’t give additional financial help due to regulations.

This news brought worries that banks may be more risk-averse, tighten their lending standards, and manage their balance sheets more conservatively. Those measures would slow economic growth and lead to further downward revisions to earnings estimates. So, it was not surprising that cyclical areas of the market were under the most pressure.

Things shifted by the close. Some nice gains in the mega cap space had the main indices close near their best levels of the day.

The upside moves were also helped along by the Swiss National Bank saying “Credit Suisse meets the capital and liquidity requirements imposed on systemically important banks. If necessary, the SNB will provide CS with liquidity.”

Data on Wednesday brought us the February Retail Sales reading, the PPI reading, and a number of other less significant pieces that I won’t mention.

February retail sales fell by -0.4% versus a consensus of +0.2%. Excluding autos the number was -0.1%, in line with expectations. The key takeaway from the report is that there were declines in most retail sales categories following large gains in January, suggesting consumers are being more conscious about their spending budgets.

February producer price index came in at -0.1% versus an expected 0.3%. Core PPI was flat compared to an expected 0.4% increase. This is overall a good inflation report, and should be pleasing to the Fed.

Thursday:

It shaped up to be a pretty good day in the stock market, but it didn’t start out that way. It started out with bank stocks remaining under pressure and Treasury yields declining in continued flights to safety.

At their lows for the day, the Dow, S&P 500, and Nasdaq were down over .5% as news came out that the European Central Bank agreed to raise its key policy rates by 50 basis points due to inflation being projected to remain too high for too long.

Sentiment shifted around midmorning, though, when a Wall Street Journal report highlighted a potential solution to the issues at First Republic Bank ($FRC). The report suggested big banks had been discussing a capital infusion deal for FRC totaling $30B.

Also, sentiment in the banking sector improved as Treasury Secretary Yellen told the Senate Finance Committee that “Americans can feel confident that their deposits will be there when they need them.”

For data on Thursday we received the Weekly Initial Claims reading, the Housing Starts report, and the February import/export data.

The Weekly Initial Claims came in well under the expectation at 192K. With initial claims were back below 200,000, we see that employers are reluctant to let workers go.

February Housing Starts hit 1.45 million, beating the expectations by over 100,000. Building Permits  hit 1.524 million, beating expectations by almost 200,000. The key takeaway from the report is that the stronger-than-expected activity wasn’t just a multi-unit story. Single-family starts were up 1.1% month-over-month while single-family permits increased 7.6%.

February Import Prices -0.1, February Import Prices ex-oil 0.4%, February Export Prices 0.2%, and February Export Prices ex-ag. 0.1%. The takeaway here is the moderation in year-over-year changes. Import prices were down 1.1%, versus up 11.4%, for the 12 months ending February 2022. Export prices were down 0.8%, versus up 16.8% for the 12 months ending February 2022.

Friday: 

On Friday’s quadruple witching options expiration day, investors were thinking risk-off again. Thursday’s strong finish was largely a relief rally on news. That relief short lived and investors sold FRC again on Friday following a dividend suspension.

Market participants were also reacting to reports that banks borrowed $11.9 billion from the Bank Term Funding Program and a record $153 billion from the Fed’s discount window for the week ending March 15, exceeding anything during the financial crisis. More and more items to digest when thinking about the health of the banking industry. Bank stocks were largely down for the day.

Selling efforts were broad in nature, excluding some mega-cap names.

Friday had an industrial production release and the Consumer Sentiment Index preliminary release for data.

Total industrial production was unchanged month-over-month in February, compared to an expected 0.5% increase. The capacity utilization rate held at 78%, also compared to an expected 0.5% increase. The key takeaway from the report is that industrial production activity is softening, evidenced both by the year-over-year decline in total production and a capacity utilization rate that is near its lowest level since September 2021.

The preliminary University of Michigan Consumer Sentiment Index for March dropped to 63.4 from 67 last month. It was expected to increase to 67.2. In the same period a year ago, the index stood at 59.4. Roughly 85% of responses had been recorded prior to the failure of Silicon Valley Bank. The key takeaway from the report is the moderation in inflation expectations, which will please the Fed somewhat, although year-ahead inflation expectations still remain well above the 2.3-3.0% range seen in the two years prior to the pandemic.

Overall, 2 of the 3 main indices ended the week on a gain. Mega caps and defensive sectors ended higher while energy, financials, industrials, and materials made substantial losses during the week.

Dividend Dollars’ Outlook & Opinion

That’s it for the recap. Now for my opinion!

This week was heavy with economic data (two key inflation reports) and plenty of banking news to keep up with. Though both inflation reports were not negative, both were overshadowed by investor anxiety related to banking.

With all of the fear surrounding banking and the treasury market volatility, it did not feel like a strong week for the markets. However, it surprisingly was!

SPX ended below all of its key moving averages at the end of the week, though it did temporarily break above the 200 day and 100 days averages on Thursday. Friday it struggled to get back above those marks.

A number of indicators have surprisingly moved into bullish territory this week including VIX OI change, ETF OI change, and VIX OI put/call ratios. SPX OI put/call ratios and general equity OI changes worsened over the week.

Banking sector uncertainties and rate changes signal more volatility to come, even though markets may continue to trend slightly higher overall, especially with a light economic calendar next week (except for the interest rate decision).

That’s it for my recap! If you would like to see how I am building my dividend portfolio using my predictions/strategy written here, you can read about my buys in my weekly portfolio update on this link.

And if you like updates like this, follow my Twitter or my CommonStock page where I post updates on the economic data throughout the week.

Regards,

Dividend Dollars

Categories
Dividend Stocks Dividends Portfolio Stock Market

Dividend Portfolio: 3/10/23 Weekly Update

Welcome back to the weekly Dividend Dollars portfolio review! I apologize for missing an article last weekend! I was traveling for a wedding and did not have time to write. This article will catch us up and detail all the moves I’ve made in the past two weeks.

This portfolio update is brought to you by Sharesight, a portfolio tracking tool that I am happy to partner with. Their platform makes tracking trading and dividend history, understanding your performance, and saving time a breeze. I wrote a review of the product that you can read here if you’re interested in learning more! Click the link above or the picture below to get a special offer only for Dividend Dollar readers!

Here at Dividend Dollars, our investing approach is a dividend growth strategy with aspects of value investing and fundamental analysis. I am a young investor in my 20’s and by sticking to this strategy over the long term, the magical powers of compounding are on my side. This allows me to more easily build substantial positions in dividend paying stocks over time, which will one day help me reach the ultimate goal of being financially free through the sources of passive income they provide. You can read more about the strategy here. Let’s dive into the portfolio review!

Portfolio Value

To date, I have invested $14,170 into the account the total value of all positions plus any cash on hand is $13,752.36. That’s a total loss of 2.95%. The account is down $641.82 for the week which is a 4.46% loss.

We started building this portfolio on 9/24/2021 and when compared to the S&P 500 we are outperforming the market so far! Within that same timeframe, the S&P 500 is down -13.3% which puts us 10.38% higher than the market! I love tracking my portfolio against a benchmark like the S&P. The above chart comes from Sharesight which makes portfolio and dividend management a breeze!

We added $440 in cash to the account in the last two weeks, trades made will be broken out below.

Portfolio

Above is a dashboard of the portfolio that tracks annual dividend income, yield, beta, dividend growth, and more.

Below is a table of everything we are invested in so far. There you can see my number of shares, shares bought through dividend reinvestments, average cost, gains, and more. The tickers in green are positions that I bought shares in this week, the blue ones are positions that I reinvested dividends into, the yellow ones are positions that announced a dividend increase this week, and the red are positions that I trimmed. Our PADI increased from $507 to $583.

Dividends

These two weeks I received $22.50 from four dividends ($XYLG, $INTC, $CMI, and $MSFT).

In my portfolio, all positions have dividend reinvestment enabled. I don’t hold onto the dividend, I don’t try to time the reinvestment, I just let my broker do it automatically.

Dividends received for 2023: $91.17

Portfolio’s Lifetime Dividends: $501.58 – WOOT WOOT $500 mark hit!

Trades

These two weeks weren’t too busy for me an account of my travels and then coming back home in midst of a major bank collapse! I deployed all of my stored cash and added even more for buys late this week in NYCB. The buy zone and the channel in the chart from two weeks ago was totally blown apart by the news in the banking sector. NYCB, BAC, and ALLY are my main bank holdings and are still safe investments in my opinion, I will be adding to them more in the coming weeks as the Silicon Valley Bank situation plays out.

I wrote about the happenings of the week in the Market Recap & Outlook, make sure to read that here and checkout out the full breakdown of my trades below:

  • February 21st, 2023
  • March 1st, 2023
    • New York Community Bank ($NYCB) – added 5 shares at $8.80
    • Global X S&P 500 Covered Call & Growth ETF ($XYLG) – $4.33 dividend reinvested
    • Intel ($INTC) – $12.20 dividend reinvested
  • March 2nd, 2023
    • New York Community Bank ($NYCB) – added 5 shares at $8.56
  • March 7th, 2023
    • New York Community Bank ($NYCB) – added 15 shares at $8.43
  • March 9th, 2023
    • New York Community Bank ($NYCB) – added 20 shares at $8.13
    • ETRACS 2xMonthly Pay Levered ETN ($SMHB) – added 10 shares at $6.63
    • Cummins ($CMI) – $3.75 dividend reinvested
    • Microsoft ($MSFT) – $2.22 dividend reinvested
  • March 10th, 2023
    • New York Community Bank ($NYCB) – added 50 shares at $7.52

Next week I will look to continue my weekly buys into $SPY, $SCHD, and $XYLG as I did not do those for the last two weeks. I will also look at adding to beaten down bank stocks even more, plus some other adds to my redder positions in $INTC and $MMM.

Summary

That is it for the update this week. The market recap and outlook is also posted and provides tons of information on what macro statistics I look to at to keep a temperature gauge on the market and inform my portfolio movements. Read that here!

Let me know what you think of the progress so far, share with me your progress and questions, interact with me on Twitter and CommonStock and other socials using the links below!

Thank you for reading! See you next week and stay safe!

Regards,

Dividend Dollars

Categories
Economics Market Recap Market Update Stock Market

Stock Market Recap & Outlook (3/10/23) – The Collapse of Silicon Valley Bank

I apologize for missing the report last week, was out on vacation but we are back now and have TONS to cover!

This weekly market recap is brought to you by Koyfin, a powerful analytical tool that I am proud to partner with. Their platform is entirely customizable for whatever data you want to look at including stocks, ETFs, mutual funds, currencies, economic data releases (one of my personal favorites used often for these posts), crypto, and even transcripts of company events! Click the link above to get a special offer only for Dividend Dollar readers or go give my product review a read if you’re interested!

Weekly Market Review

It was a big losing week for the market as investors analyzed Fed Chair Powell’s testimony before Congress, the February employment report, and news of SVB Financial’s Silicon Valley Bank being shut down. All major indices ended the week down over 3.5%.

Monday started on an upbeat note with early gains being supported by positive moves in some mega cap stocks. Apple ($AAPL) was a leader in that respect after Goldman Sachs initiated coverage with buy rating with a $199 price target.

Under the surface though, there was some anxiousness felt as the market waited for key events in the week ahead. Even at midday, as the indices were trading near their highs for the day, the number of stocks declining was greater than the number of stocks increasing.

Mega cap strength started to face and selling ramped up in the Treasury market. The main indices were in a slow grind lower for the rest of the day.

Economic data for the day was only the January Factory Orders. This fell 1.6% month-over-month (consensus -1.8%). Shipments of manufactured goods increased 0.7% MoM after falling 0.6% in December. The key item in the report was the strength seen in nondefense capital goods orders, excluding aircraft. This criteria, which factors into GDP forecasts, were up 1.1% after a 0.6% decline in the last reading.

Tuesday started mixed with the market waiting for Powell’s testimony before the Senate Banking Committee. Both stock and bond markets reacted quickly to key comments.

Powell stated, “Although inflation has been moderating in recent months, the process of getting inflation back down to 2% has a long wat to go and is likely to be bumpy… the latest economic data have come in stronger than expected, which suggests that the ultimate level of interest rates is likely to be higher than previously anticipated. If the totality of the data were to indicate that faster tightening is warranted, we would be prepared to increase the pace of rate hikes. Restoring price stability will likely require that we maintain a restrictive stance of monetary policy for some time.”

Powell’s Q&A portion afterwards added that data doesn’t suggest that the Fed has overtightened yet. Data suggests they have more work to do, increasing the likelihood that peek rates are higher than the Fed’s projections from the December meeting may be increased. The hearing and Q&A session ultimately suggested that a 50 point hike is back on the table. Markets moved lower throughout the day upon this news.

Data on Tuesday was the January Wholesale Inventories and the Consumer Credit reading. Inventories were down 0.4% MoM and was in line with expectations.

Consumer Credit increased by $14.8B in January compared to the expected $22.9B. The takeaway is that consumer credit expansion is slowing, likely a result of rising interest rates. The decrease was driven predominantly by revolving credit and was the 2nd lowest increase in the last 12 months.

Wednesday had the markets start off choppy as the second day of Powell’s testimony kicked off. Treasury markets signaled economic concerns with the 2 year and 10 year spread hitting its widest margin since 1981.

With that move, stock prices deteriorated and the major indices slipped closer to their lows of the day. They did close above the lows, though, thanks to mega-caps running in the last hour of the day. That momentum slowed with the S&P 500 neared its 50 day moving average ($3,997) which turned from support to resistance on Tuesday.

Economic data for the day included the Weekly MBA Mortgage Applications, ADP Employment Change, the JOLTs job report, and the January trade deficit reading.

The weekly MBA mortgage application index rose 7.4% with refinancing applications increasing 9.0% and purchase applications 7.0%.

The ADP Employment Change showed private payrolls rose by 242,000 in February against a 195,000 consensus. The January reading was revised upwards by 13,000.

The JOLTS Job Openings reading total 10.8M in January after a 0.2M upward revision for December.

The trade deficit for January grew to $68.3B compared a consensus of -$69B. December numbers were revised upwards by $0.2B. Imports for January were $9.6B more than December imports. Exports were $8.5B more than December exports. The takeaway here is that both imports and exports increased compared to December, reflecting a pickup in global activity and demand.

Then Thursday came around, and the situation that we’ve all been watching unfold for days now had kicked off.

The day started green, lead again by mega-caps and hope that higher-than-expect jobless claims could be followed by a weaker-than-expected nonfarm payrolls reading on Friday.

Initial jobless claims for first week of March increased by 21,000 to 211,000 compared to a consensus of 198,000. Continuing claims increased by 69,000. This was the highest claims level since December and teased the idea of some labor softening. However, current claims levels still are at levels that are indicative of a tight labor market overall.

The opening was short lived as bad news and price action in the banking space weighed down the market.

The S&P 500 cut under its 200 day moving average and closed near lows for the session in a steady and broad based sell off.

Bank stocks took the bulk of the losses as concerns about rising rates, higher deposit costs, and weaker loan demand collided with the news that Silvergate Capital ($SI) is voluntarily liquidating and that SVB Financial Group ($SIVB) sought to raise capital through the sale of marketable assets at a loss and a potential stock offering to combat their increased cash burn.

The second part of that last paragraph was the main trigger of worries about the state of deposits and capital positions for smaller banks that drove major selling interest.

Ultimately, things break when the Fed is in an aggressive tightening cycle, and banks, whether or not they are involved in a specific problem, will get pulled into the downfall regardless of their roll.

Treasury yields also fell lower that day, yet stocks did not respond in the opposite way. This leads us to believe that the flight to treasuries was more of a flight-to-safety than anything else.

Friday opened considerably lower and kept that theme up for most of the day. The employment report brought some good news with nonfarm payrolls being strong and average earnings growth being weaker, but the SVB Financial situation was by far the largest driver of price action. A broad sell off brought the S&P 500 under 3,900 on big volume.

Silicon Valley Bank was shut down by the FDIC in the late morning. This is the second largest bank to get shut down by the FDIC since Washington Mutual in 2008.

The FDIC also created the Deposit Insurance National Bank of Santa Clara to protect insured depositors of $SIVB. This news followed earlier reports that the Founders Fund (Peter Theil’s VC fund) had advised companies to pull their money out of the bank and that deposit outflows were outpacing the process of selling SVB to a prospective buying banks.

Wide concerns about SVB’s troubles and their potential contagion effects continued the flight-to-safety in the Treasury markets on Friday.

Most views from analysts so far are that SVB’s situation won’t be a systematic banking problem given how well capitalized the system is. That said, the market saw a rebound effort squised after it was reported the SVB was being shut down. The market lost their hold and broad based selling picked up putting the S&P 500 to a low of $3,846.

The sudden collapse of SVB could leave billions of dollars belonging to companies and investors stranded. As of the end of 2022, SVB was the 16th largest bank in the US with just over $200B in assets. Their tech and start up focus has felt the brunt of the aggressive interest rate hikes by Fed.

The Treasury bond assets they sold on Thursday incurred a $1.8B loss as the value of those bonds fell with the rising rates, the value of their hold to maturity assets have incurred an even larger, though unrealized, loss.

The main office and all branches will reopen on Monday and all insured depositors will have full access to their insured funds. That is good news, however, roughly 89% of the banks $175B in deposits were uninsured as of the end of 2022. What happens to these funds is anyone’s guess.

We can assume that the FDIC is working this weekend to find a bank that is willing to acquire SVB. A merger by Monday could secure the safety of those uninsured deposits, but no deal is certain.

I have seen headlines that Roblox Corp ($RBLX) and Roku Inc ($ROKU) have hundreds of millions deposited with the bank. With most of these funds uninsured, share prices have dropped by a considerable amount.

Collectively, the banking sector has lost over $100B in stock market value from Thursday and Friday, with European banks also feeling some pain. Some analysts are forecasting more pain for the sector as hidden risks become more clear.

All eyes will be on the FDIC and if they are able to secure an acquirer for SVB or if they will be force to liquidate the bank.

Dividend Dollars’ Outlook & Opinion

That’s it for the recap. Now for my opinion!

To be blunt, this week was insane. The market made big moves down on the SVB news. Economic readings and Fed speak were worth paying attention, but when it really came down to it SVB and the concern it has caused for the banking sector has defined this week. It may even be the definitive moment for the year.

This week was so red that $SPX broke down through numerous key points. The week started above every key point of support, but quickly took them all out as the week came to an end. The market broke through the 50 day moving average first on Tuesday, then the 100 and 200 day moving average on Thursday, and broke down below the long term downtrend established at all time highs in the beginning of 2022 before testing the bear market level at $3,855.

Price action broke down below that level briefly before ending the week just above it at $3,861.86.

As you can see by the three circles I have on the chart, following significant breakdowns underneath the bear market level, the following days are extremely volatile. I expect the next fews days to not be an exception, if anything they’ll turn up the volatility as the SVB situation unfolds.

Up until this week, the market in 2023 has been playing red-light green-light with inflation readings and Fed meetings. Markets have been quick to react to every little item that gives insight into what the Fed will do moving forward.

Now we had a giant wrench thrown into that theme this week. Fed Powell’s testimony affirmed the position that Fed is willing to pick up the pace on rate hikes if economic data shows it is needed. Add to that, SVB has collapsed due to the effects that these rate hikes have had on them as bank and their customers. Granted, there’s a lot to pick apart and criticize with that situation as safe and sound banking strategies are not wholly evident, however, it is yet to be seen if this situation will change the Fed’s approach at all.

Will they remain focused on inflation and protecting the value of the dollar despite the giant problem on the horizon that is the SVB collapse? We will have to wait and see till the next rate decision on 3/22/23.

Because of this, the CPI report on Tuesday and the employment reports that follow may be difficult for the market to wrap their heads around the meaning of those readings. Anticipate a lot of volatility as all eyes are on this situation and Fed.

I anticipate more red next week, mostly due to investors being jaded by SVB and the effects on the market, but also as a result of the CPI and PPI reports. Forecasts for both are expecting an improvement on the MoM and YoY readings. If these come in higher than expected, expect the negative reaction to be larger than normal.

That’s it for my recap! Go check out my portfolio update to see how I am navigating these markets while building dividend-based wealth.

And if you like updates like this, follow my Twitter or my CommonStock page where I post updates on the economic data throughout the week.

Regards,

Dividend Dollars

Categories
Earnings Economics Market Recap Stock Market

Stock Market Recap & Outlook (2/24/23) – Inflation is back! FOMC minutes and PCE shock!

This weekly market recap is brought to you by Koyfin, a powerful analytical tool that I am proud to partner with. Their platform is entirely customizable for whatever data you want to look at including stocks, ETFs, mutual funds, currencies, economic data releases (one of my personal favorites used often for these posts), crypto, and even transcripts of company events! Click the link above to get a special offer only for Dividend Dollar readers or go give my product review a read if you’re interested!

Weekly Market Review

This shortened holiday week ended up being another losing one, held down by the same issues that beat down price action last week. There’s a lingering sense that the market was due for consolidation and a growing idea that the Fed will keep rates higher for longer.

Fed concerns were the focus midweek when the FOMC minutes for the February 1st meeting were released. They weren’t aggressively hawkish or dovish, their default position continues to be a rate-hike position.

Markets are aware that many of the data releases since the last FOMC meeting are not likely to change the Fed’s mindset. A stronger than expected January employment report, the stronger than expected ISM Services PMI, the January CPI and PPI reports, all capped off by this week’s stronger than expected core PCE, which is the Fed’s preferred inflation measurement.

After the hot PCE reading on Friday, St. Louis Fed President Bullard said that “it appears that the Fed may be able to disinflate in an orderly manner and achieve a soft landing”.

Prior to that, there was some movement higher on Thursday, following NVIDIA’s ($NVDA) earnings and positive guidance. However, the market primarily had downside bias this week and took out its 50-day moving average before testing the 200-day average.

The Treasury market was boosted off of the price action in equities this week, creating tough competition for returns from stocks. The 2-year note rose to 4.78% and the 10 year note rose to 3.95%. The dollar index also rose this week by 1.4%.

None of the 11 S&P sectors made gains this week. Energy was close at -0.04% while consumer discretionary and real estate were hit the hardest will losses over -4%.

Below are summaries of daily price action throughout the week:

  • Tuesday
    • The week started lower on increasing geopolitical tensions and continued money being taken off of the table following last month’s rally for a close under 4,000.
    • News reports state that China’s President Xi Jinping may go to Moscow in April or May to meet with Putin and encourage peace talks, a view that seems to run counter to the assumed supportive relationship between Xi and Putin
    • Disappointing guidance came from Home Depot ($HD) and Walmart ($WMT) and helped push consumer discretionaries down to last place.
    • The January Existing Home Sales fell -0.7% to 4 million (consensus 4.12). Key takeaway is that sales are still under pressure of high mortgage rates and economic uncertainty. This keeps homes on the market for longer and may cause a moderation in median prices over time.
  • Wednesday
    • The day started on a positive note, but moves were modest as the market waited for the release of FOMC minutes.
    • The FOMC minutes indicated that “more evidence of progress across a broader range of prices would be required to be confident that inflation was on a sustained downward path.” A number of members also wanted raise rate by 50 points at the meeting
    • .Immediately when the minutes were released, price action in the market whipsawed before settling into a slow decline
  • Thursday
    • This day was a more upbeat day, breaking a 4 day losing streak on $SPY following the earnings and good guidance from NVIDIA.
    • Prices got pushed down as other disappointing earnings came out ($EBAY, $DG, and $DPZ are some names that come to mind in that regard). The key takeaway was that consumers are slowing their discretionary spending causing slower growth and further cuts to earnings estimates in the sector, all while the Fed looks intent to raise rates higher.
    • Downside pushed the S&P below the 4,000 level and its 50 day SMA. Buyers stepped in and finished the session with decent gains.
    • Initial Jobless Claims declined to 192k (consensus 200k) and continuing claims decreased to 1.654M. The low levels of initial claims contribute to expectations for the Fed keeping rates higher longer.
    • The second Q4 2022 GDP estimate showed a downward revision to 2.7% (consensus 2.9%). The drive down was moved by less personal spending which was partially offset by an increase in non-residential investment. This could be an off-putting mix for the Fed. Growth and inflation is still running hot, one of them must give.
  • Friday
    • The week ended with board-based selling following the hotter than expected PCE reading.
    • The Core-PCE price index rose 4.7% year-over-year versus 4.6% in December. Real disposable income was up 1.4% month-over-month and personal savings rate increased to 4.7%, indicating that consumers can keep spending.
    • The key was that the report showed inflation, not disinflation, and good spending potential which can keep the economy running above potential. That combo causes concerns about inflation being sticky and prompting the Fed to stick to tightening for harder and longer than expected.
    • The S&P closed below its 50 day SMA and tested its 200 day SMA, recovering a bit from the lows of the day before close.

Dividend Dollars’ Outlook & Opinion

That’s it for the recap. Now for my opinion!

This week was another week of consolidation and modest losses that we have been discussing in this outlook section for 3 editions now.

This was a light week in terms of quantity of economic data, however, the few releases we did have were heavy hitters. The Core PCE reading confirmed that the inflation moderation which began in June of last year has mostly leveled off, and at a level that is much higher than the Fed would like. Pair that with the fifth straight week of initial jobless claims under 200k, and you can see that the labor market is strong and able to withstand further tightening.

Earnings continued this week with 55 S&P 500 participants reporting. 44 of them beat EPS expectations. Overall, 98% of the S&P stocks have reported. Below so far are the aggregate beat rates this quarter compared to prior quarters. These figures are tracked using MarketBeat.

Now moving on to technicals. Last week pointed to slightly bearish with high volatility, and that was what we got! Within a month after the SPX broke through the long-term downtrend (red channel), 4,100 level (top green line), and hit a technical golden cross, did it struggle to keep strength. SPX broke through support at the 50 day SMA on Friday, and has the 200 and 100 day SMA not far under it for support and are converging with the downtrend. Who knows if these will hold, but they should at least slow the downtrend.

Other metrics have shifted moderately bullish. VIX put OI grew more than call OI, SPX call OI grew more than puts, and call OI for major ETFS also grew more than puts for the week, a moderately bullish change. However, the Vix volume put to call ratio moved from neutral to moderately bearish this week at 0.34. SPX volume put to call ratio looks neutral.

Overall, technical have deteriorated and inflation is not moderating. With earnings season basically over, three weeks till the next inflation report, four weeks till the next rate hike, the market may move on news headlines and Fed speak more than usual in the near term.

Technicals and inflation look we move down, a number of metrics have improved and look like we move up, and major economic releases are a few weeks out. Short term time frame looks to be volatile and set up for an oversold bounce before chop and downtrend continues. With that said, I’m neutral for next week and could see the market being moderately down or up. This is one of those weird weeks looking forward where all this analysis may not really help!

That’s it for my recap! If you would like to see how I am building my dividend portfolio using my predictions/strategy written here, you can read about my buys in my weekly portfolio update on this link.

And if you like updates like this, follow my Twitter or my CommonStock page where I post updates on the economic data throughout the week.

Regards,

Dividend Dollars

Categories
Earnings Economics Market Recap Market Update Stock Market

Stock Market Recap & Outlook (2/17/23) – Continued Earnings and Mixed Week

This weekly market recap is brought to you by Koyfin, a powerful analytical tool that I am proud to partner with. Their platform is entirely customizable for whatever data you want to look at including stocks, ETFs, mutual funds, currencies, economic data releases (one of my personal favorites used often for these posts), crypto, and even transcripts of company events! Click the link above to get a special offer only for Dividend Dollar readers or go give my product review a read if you’re interested!

Weekly Market Review

The major indices ended down this week for the second week in a row, first time in 2023. Instability in the market was driven by reactions to economic releases and Fed comments throughout the week.

MoM inflation data in the January Consumer Price Index (CPI) was not pleasing, but the report showed continued deceleration on a YoY basis. Services inflation, the section that the Fed seems to care about the most, was the exception with a jump to 7.2% YoY from 7.0% in December.

Then a stronger than expected January retail sales report, higher-than-expected producer price data for January, and another remarkably low level of weekly initial jobless claims were released in the following days.

The positive economic news paired with accelerating services inflation, fueled concerns about the possibility of the Fed raising rates more and keeping them higher for longer than previously expected.

Fed comments this week seemed to corroborate those concerns. Cleveland Fed President Mester said she advocated for a 50-basis point rate hike at the last meeting,  St. Louis Fed President Bullard shared the same sentiment, and Fed Governor Bowman said that hikes are needed until “a lot more progress” has been made on inflation.

5 of the 11 S&P 500 sectors made gains week led by consumer discretionary (+1.6%) and utilities (+1.1%). The energy sector (-6.3%) was the worst performer by a long shot with falling oil prices.

Below are breakdowns of daily action for the week.

Monday:

  • A quick dip right out of the gate had the S&P 500 slip below the 4,100 level before buyers stepped in and a rally effort took root.
  • Mega caps were driver of index gains. Meta Platforms ($META) and Microsoft ($MSFT) each rose more than 3.0% on Monday with no specific catalysts.
  • The NY Fed’s Survey of Consumer Expectations showed that inflation expectations are stable, but household income growth expectations have dropped.
    • “Median inflation expectations remained unchanged at the one-year-ahead horizon, decreased by 0.2 percentage point at the three-year-ahead horizon, and increased by 0.1 percentage point at the five-year-ahead horizon, to 5.0%, 2.7% and 2.5%, respectively.”Disagreement on these figures decreased slightly YoY
    • The median expected growth in household income dropped to 3.3%. This is the largest one-month drop in the 10-year history of the series and is the first drop since last September.

Tuesday:

  • Tuesday’s trade was mixed as investors digested the January Consumer Price Index (CPI) released in early hours.
  • Total CPI increased 0.5% MoM (in line with consensus) and is shown in the graph below. Core-CPI increased 0.4% MoM (in line with consensus).
  • On a YoY basis, total CPI was up 6.4% (the smallest 12-month increase since October 2021) and core-CPI was up 5.6% (the smallest 12-month increase since December 2021). The YoY levels were not as low as expected AND services inflation hit 7.2% YoY from 7.0% last month.
  • The key CPI takeaway is that there has been a clear deceleration from peak inflation; however, the inflation rates are nowhere near low enough for the Fed to even think about cutting rates this year.
  • The market moved higher shortly after the open. The early gains faded, and the S&P 500 briefly slipped below the 4,100 level. There was a bounce late day and closed the session above intraday lows. 
  • Treasury yields seemed to have a more concrete reaction to the CPI data as yields jumped and closed higher.

Wednesday:

  • Ahead of Wednesday’s open was the retail report, which reflected continued strength in the economy, but left the market concerned that it boosts the likelihood of higher rates. Total sales in January were up 3.0% MoM (consensus 1.7%) and sales, excluding autos, up 2.3% ( consensus 0.8%).
    • The key takeaway from the report is that consumers were spending freely on goods in January despite inflation pressure; in fact, every single sales category showed a MoM increase, led by a 7.2% surge in sales at food services and drinking places.
  • The January Industrial Production came in flat (consensus 0.5%) and Capacity Utilization came in  78.3% (consensus 79.1%).
    • The soft reading for January can be attributed entirely to a drop in utility output. Otherwise, there was some strength in mining and manufacturing output, the latter of which saw advances in durable, nondurable, and other manufacturing activity.
  • Equities started down, but true to 2023 form, investors stepped in to buy the early weakness. The main indices all closed the session at or near their best levels of the day.
  • High-beta stocks, uplifted by the positive earnings news and guidance from the likes of Airbnb ($ABNB), Roblox ($RBLX), and Analog Devices ($ADI), helped Wednesday’s gains.

Thursday:

  • Thursday was down in the start and the finish. The negative bias was brought on by the higher-than-expected Producer Price Index (PPI) number for January and another low level of weekly initial jobless claims, which fueled concerns that the Fed will not pause its rate hikes in the near future.
  • January PPI came in at 0.7% shown below (consensus 0.4%) and Core PPI at 0.5% (consensus 0.3%).
    • The key takeaway from the report for the market is that headline inflation was hotter than expected on a monthly basis and causes concerns about inflation pressures persisting at higher levels for longer than expected.
  • Weekly Initial Claims shown below came in at 194K (consensus 203K) and Continuing Claims at 1.696 million
    • The persistence of initial claims below 200,000 reflects a very tight labor market, and a reluctance to cut workforces, which will continue to drive worries at the Fed about tight labor market conditions feeding into stickier wage-based inflation pressures as reflected in high service readings.
  • The market recovery mid-day coincided with buyers stepping in when the S&P 500 breached the 4,100 level, along with Treasury yields backing down from their post-data release highs.
  • There was a steep reversal in the last hour that had the major indices close the session near their worst levels of the day, which took the S&P 500 below 4,100 again.
  • The late afternoon plunge was precipitated by Fed speak we previously mentioned (except for Mester, who spoke prior to the plunge).

Friday:

  • The stock market opened weak continuing Thursday’s downside momentum.
  • Treasury yields began to settle and stock sentiment shifted slightly higher.
  • Ultimately, the indices closed the session near their best levels of the day even though some mega cap names were not following.

Dividend Dollars’ Outlook & Opinion

That’s it for the recap. Now for my opinion!

This week was another week of consolidation and modest losses and matched perfectly with the “technicals suggest a flat or slightly bearish week ahead” call from last week’s report. This is the second week in a row of this since I called for a slowdown in the market outlook from 2/3/23.

We had two key inflation reports with the CPI and PPI, both came in well above their estimates causing a fair amount of volatility. One flaw from this report last week was that I did not touch on the coming PPI report. Historically, the PPI tends to not move the market as much as the CPI, however the bigger miss on PPI proved otherwise this week.

As you can see in the chart below, while still quite historically high, the YoY PPI (white) and CPI (blue) peaked in June of last year. They continue to trend lower.

Earnings reports this week had 59 reports of the S&P 500 companies, putting us 81% of the way through earnings season. 41 of the 59 this week beat EPS expectations, below so far are the aggregate beat rates this quarter compared to prior quarters. These figures are tracked using MarketBeat.

Now moving on to technicals. Only three weeks after the SPX broke above the long-term downtrend (red channel), broke above resistance at 4,100 (top green line), and hit a golden cross (white arrow) and the SPX has struggled to hold the support line at 4,100. The first half of the week looked decent, but the last two days did not. Ending the week under that level and establishing a new low on 2/17 compared to the last low on 2/10 looks like a technical breakdown. SPX may be trending in the down direction in the near term.

Other metrics have shifted into bearish territory since last week. SPX OI changes grew more this last week on the put side which is moderately bearish. ETF OI changes were slightly more on the put side, but not enough to make it bearish, I consider this to be neutral. The VIX open interest put/call ratio is down almost 10% this week, this movement follows the VIX index and implies that VIX is likely to go higher moderately in the near term. This is slightly bearish. SPXOICPR saw a similar move.

Overall, metrics like the above, failure of near-term technical support, hawkish Fed comments, a concluding earnings season, a five week wait till the next FOMC meeting, and mixed economic data all make the market look fairly mixed or slightly bearish in the near-term. Next week is light on the economic data front except for Core PCE (the Fed’s preferred inflation gauge) out on Friday. With a holiday on Monday and an apparent waiting period till the big Core PCE report on Friday, I’m anticipating a choppy week till end of week with Core PCE determining the final move.

That’s it for my recap! If you would like to see how I am building my dividend portfolio using my predictions/strategy written here, you can read about my buys in my weekly portfolio update on this link.

And if you like updates like this, follow my Twitter or my CommonStock page where I post updates on the economic data throughout the week.

Regards,

Dividend Dollars

Categories
Economics Market Recap Market Update Stock Market

Stock Market Recap & Outlook (2/10/23) – Continued Earnings and Mixed Week

This weekly market recap is brought to you by Koyfin, a powerful analytical tool that I am proud to partner with. Their platform is entirely customizable for whatever data you want to look at including stocks, ETFs, mutual funds, currencies, economic data releases (one of my personal favorites used often for these posts), crypto, and even transcripts of company events! Click the link above to get a special offer only for Dividend Dollar readers or go give my product review a read if you’re interested!

Weekly Market Review

The rally lost some steam this week due a sense that we were due for a drawdown or some consolidation on the back of rate-hike and valuation concerns. After last Friday’s January employment report surprise, there wasn’t a great deal of conviction on the sell side or the buy side this week. Ultimately, the indices all registered losses, which had the S&P 500 settle Friday’s session below the 4,100 level.

Monday, the market was slow to open as we were hesitant of Fed Chair Powell’s “Conversation with David Rubenstein” at the Economic Club of Washington, D.C. on Tuesday. Heightened geopolitical tension after the U.S. shot down China’s suspected spy balloon off the South Carolina coast last Saturday may have also contributed to the slow start.

The indices rebounded from their opening lows but could never seem to hold onto any momentum. We spent much of Monday moving sideways in a tight trading range. The Dow Jones Industrial Average briefly scooted above its range in late afternoon before fading again into negative territory.

Tuesday, unsurprisingly started on a mixed note. The main indices oscillated around their flat lines in the first half of the day as investors awaited the aforementioned Powell talk.

Mr. Powell didn’t say anything too surprising, but the market responded with some volatile price action nonetheless. The main indices initially shot higher off of Powell’s calm response to the surprise employment report last friday.

That initial jump gave way to selling pressure after Mr. Powell said that the Fed will react to the incoming data and will do more rate hikes if the data suggest that is necessary. A response that we have been hearing for some time. He also said that the Fed has a significant road ahead to get inflation down to 2% and that he thinks it won’t be a quick move to that goal

The following reversal in the indices saw the S&P 500 breach support at the 4,100 level, where buyers stepped in for a technical rebound, supported by short-covering activity. The indices closed near their best levels on Tuesday.

Also helping late Tuesday was a rally in Microsoft ($MSFT) and other AI-related stocks after Microsoft announced its new AI-powered Microsoft Bing search engine and Edge browser.

On Tuesday, we also got the December Trade Balance report. It came in at -$67.4 bln compared to a consensus of -%68.5 bln. The prior reading was revised to -$61.0 bln from -$61.5 bln.

The key takeaway from the report is that it reflected a slowdown in global trade, evidenced by a $2.1 billion decline in the 3-month moving average for the goods and services deficit to $68.6 billion that resulted from a $2.6 billion decrease in average exports and a $4.7 billion decrease in average imports.

We also got the Fed’s Consumer Credit report which showed that total outstanding credit increased by $11.6 bln in November following an upwardly revised $33.1 bln in November.

The key takeaway from the report is that total consumer credit expansion slowed in December, with higher interest rates crimping loan demand. Nonrevolving credit saw its smallest expansion ($4.3 billion) since August 2020.

Then, stocks spent Wednesday drawing down largely due to concerns that the market got overextended and was due for some consolidation. Selling efforts were broad based but generally modest overall.

A notable exception was Alphabet ($GOOG), which tanked 7.4%. Shares were falling on concerns the company is behind in the AI space — a concern that was magnified by news that its Bard AI bot gave a wrong answer at the company’s launch event.

Weakness may have also been exacerbated by Biden’s State of the Union address where he called for a billionaire minimum tax, a quadrupling of the tax on corporate stock buybacks, and raising the debt limit without conditions. He also made a case for more antitrust regulation of technology companies.

With a divided Congress, the market wasn’t overly concerned about new tax policies being passed, but it was interested in what happens with the debt limit discussions and the possibility more regulations.

We also received data on the Weekly MBA Mortgage Applications Index (7.4%; Prior -9.0%) and the December Wholesale Inventories 0.1%. Prior was revised to 0.9% from 1.0%.

The stock market started Thursday higher, yet the bulls were soon corralled and the major indices spent most of the day retracing their opening steps in what became a trend-down day. The selling that took place was broad based and left the S&P 500 below 4,100 at the closing bell.

A favorable response to Walt Disney’s ($DIS) better-than-expected fiscal Q1 earnings report and restructuring announcement, falling Treasury yields, and another weekly initial jobless claims report that was supportive of the soft landing scenario provided the fuel for the opening bid.

Thursday’s open continued ideas of potential overvaluation. Treasury yields then started to move up and the market slipped consistently on the fostered selling.

Friday ended the week on a stable note ahead of key data releases next week, including the Consumer Price Index, Retail Sales, Industrial Production, Housing Starts, and Producer Price Index reports all from January.

There was not much conviction from buyers or sellers, which left the S&P 500 and Dow with small gains while the Nasdaq logged a modest loss. Mega cap stocks seemed to lag, keeping pressure on index level performance. Tesla ($TSLA) was a losing standout among the mega cap stocks amid investors’ concerns that a potential Department of Transportation order could force Tesla to make its charging stations available to other electric vehicles.

Oil prices climbed up some lost ground on Friday, which also pressured the equity market, in response to Russia saying it is going to cut production by 500,000 barrels per day in March in response to international sanctions.

Friday saw the February Consumer Sentiment report come in with a reading of 66.4 (Prior 64.9).

The key takeaway from the report is the understanding that the year-ahead inflation expectation increased from January, raising concerns about consumers’ future discretionary spending capacity.

Only 1 of the 11 S&P 500 sectors made gains this week – energy (+4.9%) — while the communication services sector (-5.6%) registered the largest decline by a wide margin.

The 2-yr Treasury note yield rose 22 basis points this week to 4.51% and the 10-yr note yield rose 21 basis points to 3.74%.

Those moves in the Treasury market reflect concerns that the recent strength in employment reports will give the Fed more room to raise rates and to keep rates higher for longer. This sentiment was also evident in the fed funds futures market, which is now pricing in a 74% probability of a third, 25-basis point rate increase at the May FOMC meeting, according to the CME FedWatch Tool, versus only a 30% probability last Thursday (i.e., the day before the employment report).

Dividend Dollars’ Outlook & Opinion

That’s it for the recap. Now for my opinion!

This week was a consolidation week, with the main indices recording only modest losses week over week. As we mentioned last week, the market got a bit too extended a little too fast, so we anticipated a consolidating week or minor moves. That is exactly what we got!

Earnings continued this week and results continue to follow the “better than feared” theme. We are about 2/3 of the way through earnings season after this week. Earnings beats stayed the same this week at 70% and revenue beats moved up to 55% from 52%. Earnings results still don’t appear to be overly bullish, and with near-term negative growth expectations it is hard to justify the level that the S&P 500 is trading at.  These figures are tracked using MarketBeat.

In recent weeks, we broke above the long term resistance (red shaded channel) and also the next level of resistance at the 4,100 level (top green line). As we called out last week, that 4,100 level did turn into support on Monday and Wednesday, but was shortly broken thereafter.

With the S&P now back under the 4,100 level (an area that was resistance back in September and December) and with earnings season closer to ending, it is hard for me to think of a reason for S&P to go higher. This is especially true if we consider the S&P’s forward P/E paired with the fact that the “E” side of things doesn’t look to be growing in the near term.

Because of this, I wouldn’t be surprised if we see some range movement between the 4,100 level and the 3,800 level (bottom green line) that created a nice base from mid-December to early January. The next FOMC meeting and coming inflationary data are the only items I can foresee being important enough to move the market out of that range, up or down.

VIX saw small gains this week and appears to be in tighter range so far this year compared to last year. The VIX structure has significantly flattened over the past few months. This could be related to a relatively more comfortable outlook regarding where the Fed stands on inflation. Other than this observation in VIX, the other items I write about sometimes (such as OI change and put to call ratios among VIX and the ETFs) did not grab my attention much. Some are leaning more bearish than last week, but not significantly so.

Overall, 2023 kicked off with a bang for bulls, however it appears that traders need a break. Macro items need some tie to play out. I anticipate more consolidations in the near term.

Fed speak this week felt moderately hawkish and bond yields are rising, giving investors lots to chew over. Next week, volatility could be present with the CPI reading on Tuesday. If it comes in significantly lower than the consensus, bulls could be off to the races again, otherwise the technical suggest flat or slightly bearish week ahead.

That’s it for my recap! If you would like to see how I am building my dividend portfolio using my predictions/strategy written here, you can read about my buys in my weekly portfolio update on this link.

And if you like updates like this, follow my Twitter or my CommonStock page where I post updates on the economic data throughout the week.

Regards,

Dividend Dollars

Categories
Dividend Stocks Dividends Portfolio Stock Market

Dividend Portfolio: 2/10/23 Weekly Update

Welcome back to the weekly Dividend Dollars portfolio review! This portfolio update is brought to you by Sharesight, a portfolio tracking tool that I am happy to partner with. Their platform makes tracking trading and dividend history, understanding your performance, and saving time a breeze. I wrote a review of the product that you can read here if you’re interested in learning more! Click the link above or the picture below to get a special offer only for Dividend Dollar readers!

Here at Dividend Dollars, our investing approach is a dividend growth strategy with aspects of value investing and fundamental analysis. I am a young investor in my 20’s and by sticking to this strategy over the long term, the magical powers of compounding are on my side. This allows me to more easily build substantial positions in dividend paying stocks over time, which will one day help me reach the ultimate goal of being financially free through the sources of passive income they provide. You can read more about the strategy here. Let’s dive into the portfolio review!

Portfolio Value

To date, I have invested $13,490 into the account the total value of all positions plus any cash on hand is $13,852.71. That’s a total gain of 2.74%. The account is down $230.10 for the week which is a 1.63% loss.

We started building this portfolio on 9/24/2021 and when compared to the S&P 500 we are outperforming the market so far! Within that same timeframe, the S&P 500 is down -8.19% which puts us 10.93% higher than the market! I love tracking my portfolio against a benchmark like the S&P. The above chart comes from Sharesight which makes portfolio and dividend management a breeze!

We added $120 in cash to the account this week, trades made will be broken out below.

Portfolio

Above is a dashboard of the portfolio that tracks annual dividend income, yield, beta, dividend growth, and more.

Below is a table of everything we are invested in so far. There you can see my number of shares, shares bought through dividend reinvestments, average cost, gains, and more. The tickers in green are positions that I bought shares in this week, the blue ones are positions that I reinvested dividends into, the yellow ones are positions that announced a dividend increase this week, and the red are positions that I trimmed. Our PADI this week decreased from $518 to $525.

Dividends

This week I received no dividends, how sad!

In my portfolio, all positions have dividend reinvestment enabled. I don’t hold onto the dividend, I don’t try to time the reinvestment, I just let my broker do it automatically.

Dividends received for 2023: $55.72

Portfolio’s Lifetime Dividends: $466.12

Trades

This week was a week of buying down into some DCA worthy positions leading into coming ex-dividend dates. We added to $AY, $MMM, and $SHOO. $AY’s next dividend hasn’t been declared yet, but I am expecting it to hit in mid-March.

The $MMM add was in anticipation of the dividend hike that was expected to be announced that day. The hike was another token small hike in order to keep their streak alive, which was to be expected given the situation with their litigations. I’ll continue to add slowly to this one, the litigations will not put $MMM out of business by any means but is a significant headwind for them in coming years. Long-term, these litigations provide a great value opportunity to buy into a powerhouse of a company.

Then both $SHOO and $ATVI were DCA’s. $ATVI was down on regulatory news, but that does not change my thesis on the merger arbitrage play with expected completion in June. At almost 4% of my portfolio, this position probably won’t get much bigger than here.

We also completed our regular ETF buys on Wednesday.

Below is a breakdown of the trades I made this week:

  • February 6th, 2023
    • Activision Blizzard ($ATVI) – added 1 share at $71.42
  • February 7th, 2023
    • 3M ($MMM) – added 0.25 shares at $115.28
  • February 8th, 2023
    • SPDR S&P 500 ETF ($SPY) – added $10 at $413.62 per share (weekly buy)
    • Global X S&P 500 Covered Call & Growth ETF ($XYLG) – added $10 at $26.73 per share (weekly buy)
    • Schwab US Dividend Equity ETF ($SCHD) – added $10 at $77.11 per share (weekly buy)
    • Steven Madden ($SHOO) – added 1 share at $34.19
  • February 9th, 2023
    • Steven Madden ($SHOO) – added 1 share at $33.91
    • Atlantica Sustainable Infrastructures ($AY) – added 1 share at $26.45
  • February 10th, 2023
    • AT&T ($T) – Covered call expired worthless, 100% gain on the premium

Next week I will continue to add $10 into each ETF ($SPY, $XYLG, and $SCHD) and will continue to hold onto some cash if the market gets lower. I have started to slowly deploy that cash in case a bottom has already been hit, but only time will tell. I really want to deploy this cash position into $CMCSA, and $INTC to build 100 share positions in them for covered call activities. I will also be watching $T for opportunities to sell covered calls.

Summary

That is it for the update this week. The market recap and outlook for this wild week will be posted soon, so make sure to have the site bookmarked or subscribe via email on the homepage!

Let me know what you think of the progress so far, share with me your progress and questions, interact with me on Twitter and CommonStock and other socials using the links below!

Thank you for reading! See you next week and stay safe!

Regards,

Dividend Dollars

Categories
Earnings Economics Market Recap Market Update Stock Market

Stock Market Recap & Outlook (2/3/23) – Continued Earnings and FOMC Meeting

This weekly market recap is brought to you by Koyfin, a powerful analytical tool that I am proud to partner with. Their platform is entirely customizable for whatever data you want to look at including stocks, ETFs, mutual funds, currencies, economic data releases (one of my personal favorites used often for these posts), crypto, and even transcripts of company events! Click the link above to get a special offer only for Dividend Dollar readers or go give my product review a read if you’re interested!

Weekly Market Review

This week started slowly as the market looked to take some money off the table following a strong January and waiting for the FOMC meeting. On Monday, the Nasdaq and S&P 500 were up 11% and 6% for January.

The slow Monday was kicked off by an article in WSJ by Nick Timiraos (chief economics correspondent for WSJ and Fed’s assumed preferred source for divulging information to) indicating that Fed officials were concerned that inflation could return to higher levels due to tight labor markets. He added that the Fed’s interest rate strategy could depend on how much members believe the economy will slow.

Anticipation of the Q4 Employment Cost Index, the January ISM releases, and the January Employment Situation Report and over 100 S&P 500 companies reporting earnings this week also added to the slow start.

The momentum changed on Tuesday as the market looked to end January with some gumption. A well-received Q4 Employment Cost Index and weaker-than-expected January Chicago PMI and Consumer Confidence data also may have led to the idea that the Fed may look to pause rate hikes.

The latter point was corroborated by another Nick Timiraos article that suggested the Employment Cost Index report could increase the possibility of Fed officials agreeing to pause the rate hikes sooner rather than later.

Wednesday came in strong to kick off the month of February . This followed the FOMC’s unanimous decision to raise the target range for the fed funds rate by 25 basis points to 4.50-4.75%, as expected. In the press conference afterwards, Powell did not go out of his way to rein in the market’s enthusiasm.

Mr. Powell acknowledged that the “Full effects of rapid tightening so far have yet to be felt and we have more work to do.” Core services inflation is still running too high, which creates a basis for ongoing rate hikes. Overall, though, Mr. Powell was generally encouraging about the signs of disinflation.

Also, he did not strictly express disagreement with loosening financial conditions and maintained that he thinks there is a path to getting inflation back down to 2% without a significant economic decline or increase in unemployment.

A huge earnings-driven gain in Meta Platforms ($META) kept rally effort strong at the start of Thursday’s session. The earnings results and reception of the FOMC materials encouraged a sense that earnings growth and monetary policy may be better than feared this year.

Some data releases on Thursday also helped with the market’s move higher. The Q4 Productivity report showed a drop in unit labor costs, an affirmation of falling inflation costs. Separately, weekly initial jobless claims hit their lowest level (183,000) since April 2022, providing additional confirmation of a strong labor market that could absorb the impact of a soft landing.

The rally did hit a speed bump at the 4,200 level for the S&P 500. The market may have reached an overextended area, though it did not last long as the main indices were able to climb back towards session highs ahead of Thursday’s close.

However, Thursday wasn’t all sunshine and rainbows as a sizable loss in Merck ($MRK) after its quarterly results kept the price-weighted Dow Jones Industrial Average in negative territory for most of Thursday.

Friday turned out to be a losing session with disappointing earnings and/or guidance from Alphabet ($GOOG), Amazon.com ($AMZN), Starbucks ($SBUX), and Ford ($F) despite a strong gain in January nonfarm payrolls (+517,000) and a stronger than expected January ISM Services PMI (55.2%) that returns the index to growth levels.

The strong data created some doubts as to whether the Fed will pause its rate hikes soon and cut rates at all before the end of the year, contrary to the case for rates in the early weekdays.

The fed funds futures market is now accounting for the prospect of a third 25 basis point rate hike in May. According to the CME FedWatch Tool, the probability of a rate hike in May, in addition to the one that is fully priced in for March, increased to 48% from 33% last week.

Many stocks pulled back on profit-taking efforts following the earnings and economic news. Apple ($AAPL), was the exception. Apple declined 2% off the open but quickly bounced and finished the day up 2.4%.

Only three S&P 500 sectors registered losses this week — energy (-5.8%), health care (-0.13%), and utilities (-1.42%) — while the communication services (+5.26%), information technology (+3.71%), and consumer discretionary (+2.34%) sectors logged the biggest gains.

Dividend Dollars’ Outlook & Opinion

That’s it for the recap. Now for my opinion!

This week crushed my moderately bullish outlook from the prior week. The market is at nearly a 9% in a little more than a month and have given back very little, even with earnings season being a bit mixed!

Q4 earnings season has reached the halfway point so far. 103 S&P 500 companies reported earnings and 74 of them beat consensus expectations this week. That puts us exactly at 250 of the 500 reporting results. The average EPS and Rev beats both increased this week, to 70% and 52% respectively. From a growth standpoint, these results are still lower compared to YoY results from last Q4. This information is tracked using MarketBeat.

Since the market broke out of the long term resistance, it has been off to the races. As we mentioned last week, the next point of resistance was around the 4,100 area that had rejected three times prior. The market broke through that level on Wednesday with strength. Then, on Thursday, we got a golden cross when the 50-day SMA moved above the 200-day SMA (yellow circle) which is a bullish technical indication.

Now that the market is above the 4,100 area, that resistance has turned into support and will be an area we want to watch if we see a small retracement in the coming days.

Overall, after a tough 2022 with lots a tax-loss harvesting ending the year, traders’ cash piles appear to be getting put to work. Communication, Consumer Discretionary, and Tech sectors priced significantly lower than where they were a year look like the areas that the cash is getting sent to. However, with a gain of almost 9% YTD, almost 3% of that coming from this week, it’s been a little too much too fast.

Vix OI change this week looks to be moderately bearish, SPX OI change is moderately bullish, ETF (SPY, QQQ, DIA, and other key ETFs) OI change is moderately bearish. The OI put call ratios for those items are neutral, moderately bearish, and moderately bearish respectively.

Vix levels in general are in the normal zone as of Friday’s close, with futures trading just slightly higher. Both are neutral indicators.

Economic data for next week is sparse, with the main items being jobless claims and consumer sentiment reports. I’ll be curious to read the wholesale inventories report and the consumer credit report, though these rarely have effects on the market.

With earnings season now past the halfway point, the next fed meeting 6 weeks away, and a number of mixed Vix and option indicators, I wouldn’t be surprised to see a bit of consolidation or small moves for the next few weeks.

That’s it for my recap! If you would like to see how I am building my dividend portfolio using my predictions/strategy written here, you can read about my buys in my weekly portfolio update on this link.

And if you like updates like this, follow my Twitter or my CommonStock page where I post updates on the economic data throughout the week.

Regards,

Dividend Dollars

Categories
Dividend Stocks Dividends Portfolio Stock Market

Dividend Portfolio: 1/20/2023 Weekly Update (Revision)

It came to my attention that I missed alerting some moves in this portfolio update! I apologize about that. This post is mostly a repost, but it does contain edits to include items that I missed. You can find these in the bolded and italicized font.

Welcome back to the weekly Dividend Dollars portfolio review! This portfolio update is brought to you by Sharesight, a portfolio tracking tool that I am happy to partner with. Their platform makes tracking trading and dividend history, understanding your performance, and saving time a breeze. I wrote a review of the product that you can read here if you’re interested in learning more! Click the link above or the picture below to get a special offer only for Dividend Dollar readers!

Here at Dividend Dollars, our investing approach is a dividend growth strategy with aspects of value investing and fundamental analysis. I am a young investor in my 20’s and by sticking to this strategy over the long term, the magical powers of compounding are on my side. This allows me to more easily build substantial positions in dividend paying stocks over time, which will one day help me reach the ultimate goal of being financially free through the sources of passive income they provide. You can read more about the strategy here. Let’s dive into the portfolio review!

Portfolio Value

To date, I have invested $13,130 into the account the total value of all positions plus any cash on hand is $13,332.90. That’s a total gain of 1.55%. The account is down $233.43 for the week which is a 1.72% loss.

We started building this portfolio on 9/24/2021 and when compared to the S&P 500 we are outperforming the market so far! Within that same timeframe, the S&P 500 is down -10.84% which puts us 12.39% higher than the market! I love tracking my portfolio against a benchmark like the S&P. The above chart comes from Sharesight which makes portfolio and dividend management a breeze!

We added $120 in cash to the account this week, trades made will be broken out below.

Portfolio

Above is a dashboard of the portfolio that tracks annual dividend income, yield, beta, dividend growth, and more.

Below is a table of everything we are invested in so far. There you can see my number of shares, shares bought through dividend reinvestments, average cost, gains, and more. The tickers in green are positions that I bought shares in this week, the blue ones are positions that I reinvested dividends into, the yellow ones are positions that announced a dividend increase this week, and the red are positions that I trimmed. Our PADI this week decreased from $500 to $505. This is mainly because of a drop in the yearly payout from $XYLG following their most recent dividend declaration.

Dividends

This week I received no dividend, bummer!

In my portfolio, all positions have dividend reinvestment enabled. I don’t hold onto the dividend, I don’t try to time the reinvestment, I just let my broker do it automatically.

Dividends received for 2023: $14.88

Portfolio’s Lifetime Dividends: $425.28

Trades

This was quite a busy week with a large mid-week dip that I took advantage of followed by a sweet two-day rally to leave the market and my portfolio significantly higher.

I made lots of buys in the portfolio on the down-day Wednesday and then a little more on Thursday. Firstly, we initiated a new position in Orsted (which I wrote a brief article on how they are poised to be a huge renewable power player in the North Sea, you can read that here), added to my favorite DCA’s of ALLY, INTC, and BAC, and also executed our weekly $10 adds in SPY, XYLG, & SCHD.

The buys on Wednesday were partially funded by sales in $JNJ and $MDT. Those positions were my only healthcare positions at the time. Though many would argue that both are strong companies and great holds, I personally don’t feel too confident in my knowledge of the sector.

I could go on and on listing the items I am not well-read on, but the main ones are: there are lots of moving parts with regulators, R&D into new drugs and technologies can be risky, patents and their expirations create frequently shifting product portfolios that need to be monitored, and increased political focus on cheaper healthcare. All of these things put the sector above my head. Now this isn’t to say that I won’t ever invest in the sector, I just simply to need to do a bit of research and familiarizing myself before committing to it.

Always invest in what your comfortable with. Take $INTC or $T for example. I’ve been following their business plans for quite some time. I am very familiar with where they’re at and where they’re going as companies. This familiarity gives me conviction and comfort. Because healthcare is pretty foreign to me, I don’t have that and am stepping back from it with these sales.

Lastly, my first covered call on AT&T expired worthless this week giving me a 100% gain on that premium. I will be watching their earnings call next week and will be looking for a spot to write another.

Below is a breakdown of the trades I made this week:

  • January 17th, 2023
    • Orsted ($DNNGY) – added 3 shares at $34.17
  • January 18th, 2023
    • Microsoft ($MSFT) – added 0.14 shares at $240.79
    • Ally Financial ($ALLY) – added 3 shares at 26.84
    • Johnson & Johnson ($JNJ) – sold position of 1 share at $170.63. Loss of $7.85.
    • Medtronic ($MDT) – sold position of 2.016938 shares at $78.87. Gain of $4.26.
    • Bank of America ($BAC) – added 2 shares at $33.72
    • Intel ($INTC) – added 2 shares at $28.77
    • SPDR S&P 500 ETF ($SPY) – added $10 at $394.45 per share (weekly buy)
    • Global X S&P 500 Covered Call & Growth ETF ($XYLG) – added $10 at $25.88 per share (weekly buy)
    • Schwab US Dividend Equity ETF ($SCHD) – added $10 at $76.39 per share (weekly buy)
  • January 19th, 2023
    • Ally Financial ($ALLY) – added 1 share at $25.70
    • Intel ($INTC) – added 1 share at $28.34
    • 3M ($MMM) – added 0.5 shares at $120.20
  • January 20th, 2023
    • Orsted ($SNNGY) – added 1 share at $29.73
    • AT&T ($T) – $20 Covered Call expired, 100% on $3 premium

Next week I will continue to add $10 into each ETF ($SPY, $XYLG, and $SCHD) and will continue to hold onto the rest of my cash if the market gets lower. I have started to slowly deploy that cash in case a bottom has already been hit, but only time will tell. I really want to deploy this cash position into $CMCSA, and $INTC to build 100 share positions in them for covered call activities.

Summary

That is it for the update this week. The market recap and outlook for this wild week will be posted on Saturday, so make sure to have the site bookmarked or subscribe via email on the homepage!

Let me know what you think of the progress so far, share with me your progress and questions, interact with me on twitter and Instagram using the links below!

Thank you for reading! See you next week and stay safe!

Regards,

Dividend Dollars