Categories
Earnings Economics Market Recap Market Update Resources Stock Market

Stock Market Recap & Outlook (1/27/23) – Earnings and Core PCE

This weekly market recap is brought to you by Koyfin, a powerful analytical tool that I am proud to partner with. Their platform is entirely customizable for whatever data you want to look at including stocks, ETFs, mutual funds, currencies, economic data releases (one of my personal favorites used often for these posts), crypto, and even transcripts of company events! Click the link above to get a special offer only for Dividend Dollar readers or go give my product review a read if you’re interested!

Weekly Market Review

The January rally carried on as investors received more market-moving earnings results and data releases this week. The positive bias had the S&P 500 get back above its 200-day moving average and stay there all week.

Things got started on an upbeat note on Monday after an article by Nick Timiraos (chief economics correspondent for WSJ and Fed’s assumed preferred source for divulging information to)  highlighted the possibility of the Fed pausing its rate hikes this spring.

Monday also brought us a survey of businesses by the NABE that conveyed a lower possibility (56% vs nearly two-thirds before) of the U.S. being in a recession or entering one.

The market hit a speed bump on Tuesday with a lot of divergent stock prices for a number of NYSE-listed stocks including Morgan Stanley ($MS), AT&T ($T), Verizon ($VZ), Nike ($NKE) and more. The abnormality quickly led to volatility halts brining many of us to wonder what was going on. The official explanation turned out to be an “exchange-related issue.” The issue seemed to be resolved quickly with announcements of some trades will be declared null.

Defense-related companies Lockheed Martin ($LMT) and Raytheon Technologies ($RTX) reported positive quarterly results.

Market strength was offset by some disappointing earnings/guidance from the likes of  Verizon ($VZ), 3M ($MMM), Union Pacific ($UNP), and General Electric ($GE), along with the news that the U.S. filed an antitrust lawsuit against Google over alleged dominance in digital advertising.

Price action on Wednesday was integral to keeping the rally alive this week. Valuation concerns from Microsoft’s ($MSFT) disappointing fiscal Q3 outlook and expected growth deceleration for its Azure business fueled a broad retreat to kick off the session.

Investors also had a negative reaction initially to results and/or guidance from the likes of Dow component Boeing ($BA), Texas Instruments ($TXN), Kimberly-Clark ($KMB), and Norfolk Southern ($NSC).

Buyers showed up quickly after the S&P 500 dipped below its 200-day moving average to push the market higher. Most stocks either narrowed their losses or completely recovered and closed the session with a gain.

After the strong reversal on Wednesday, Tesla ($TSLA) reported strong quarterly results and outlook, which helped the rebound in the mega cap space, and Chevron ($CVX) announced a massive $75 billion stock repurchase program announcement.

There was also a number of positive data releases Thursday that helped support a positive bias. The Advance Q4 GDP Report increased at an annual rate of 2.9% in the fourth quarter of 2022. The second estimate will be released towards the end of February.

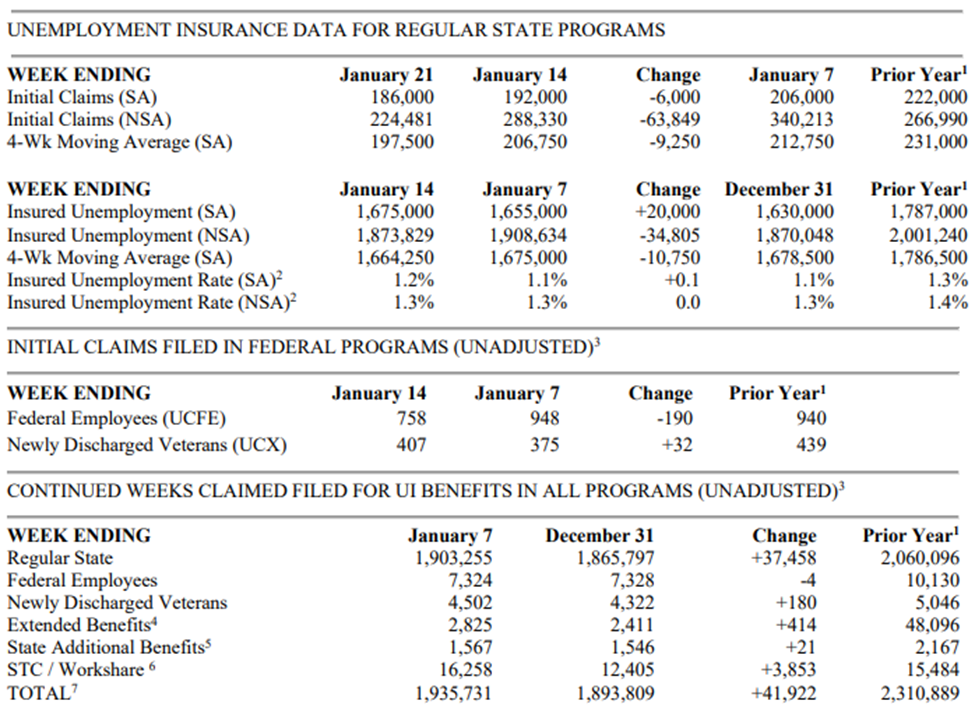
Weekly initial jobless claims unexpectedly decreased by 6,000 compared to the previous week. The current level of 186,000 is well below the 4-week moving average of 197,500.

December durable goods orders came in better than expected, as well. Orders increased 5.6% month over month to $286.9B versus an estimated 2.5%. This is especially a good reading compared to a -1.7% decrease from revised numbers last month. Excluding defense, the durable goods orders were up 6.3% for the month. Inventories, up for 23 consecutive months at this point, increase again by 0.7%.

The rally effort continued on Friday despite Intel ($INTC) reporting ugly results and guidance, KLA Corp. ($KLAC) issuing below-consensus guidance, Chevron ($CVX) missing on earnings estimates, and Hasbro ($HAS) issuing a Q4 profit warning.

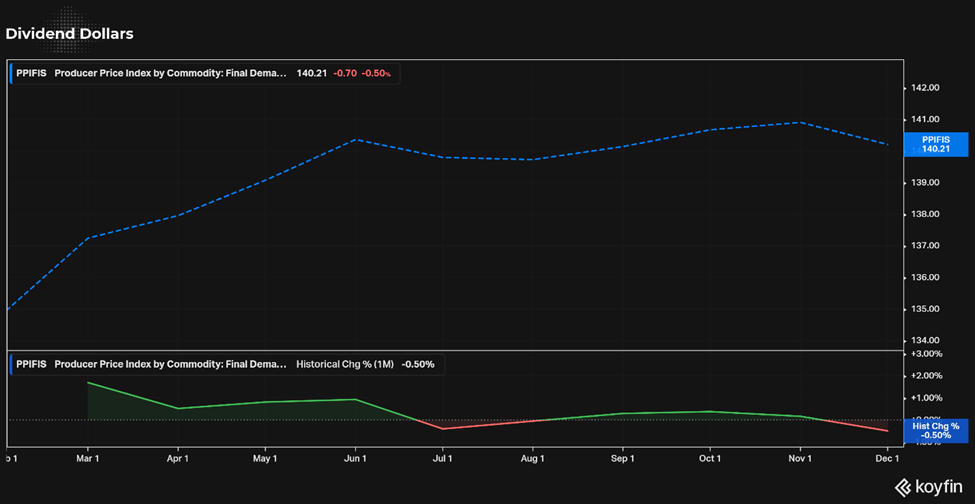
On Friday, the PCE Price Index was released. Results were up 0.1% month-over-month while the core-PCE Price Index, which excludes food and energy, was up 0.3%, as expected. That left the year-over-year changes at 5.0% and 4.4%, respectively, versus 5.5% and 4.7% in November.

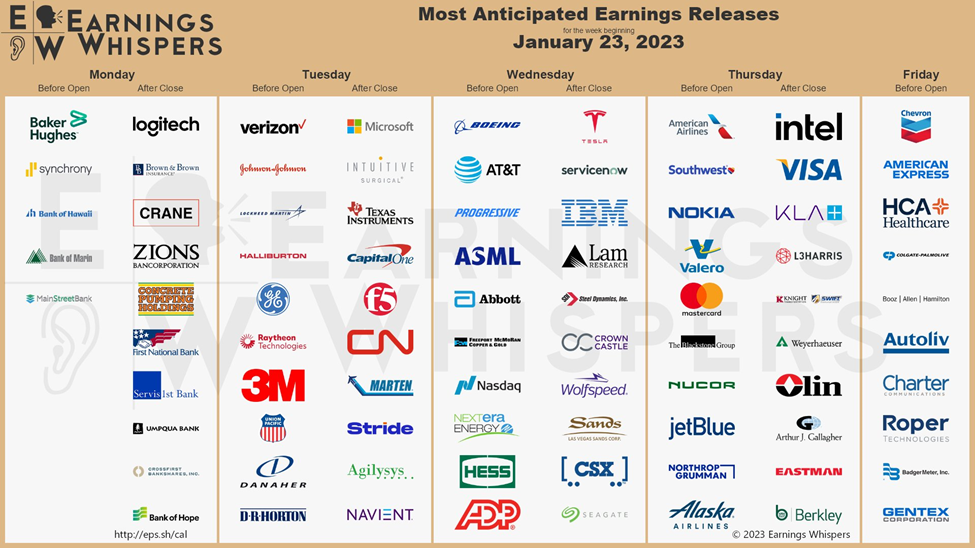
There was a sharp pullback before Friday’s close, as people took money off of the table heading into a big week of earnings next week from Alphabet ($GOOG), Apple ($AAPL), Amazon ($AMZN), and Meta. Other catalysts include the FOMC decision and the January Employment Report.

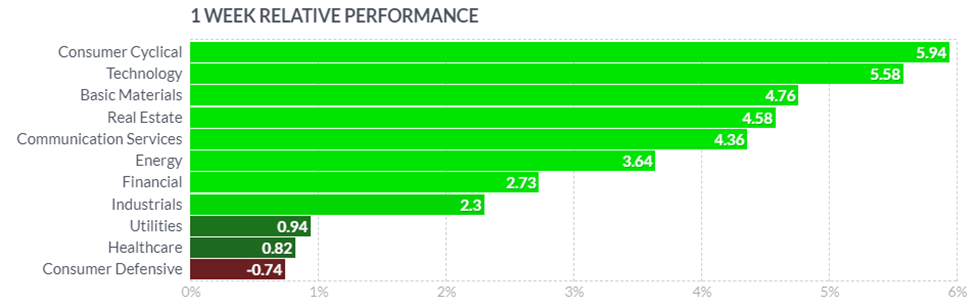
Only two S&P 500 sectors registered losses this week — utilities (-0.5%) and health care (-0.9%) — while the consumer discretionary (+6.4%), information technology (+4.1%), and communication services (+3.3%) sectors led the outperformers.


Dividend Dollars’ Outlook & Opinion

That’s it for the recap. Now for my opinion!

As mentioned in the last market update, I was expecting a red week this week and people took money off the table leading into an earnings heavy week. My other, less anticipated call, was that stocks could break above the downtrend line. This was the outcome to took precedent.

Stocks looked to trend higher this week and was supported by better than feared (notice the “better than feared” vs “better than expected” clarification was intentional) earnings reports and economic data! No data report this week was too good or too bad, and more items like this support the chance of an actual soft landing for the economy. We will have a better feeling for this next week after the FOMC meeting, but in the meantime bias is positive.

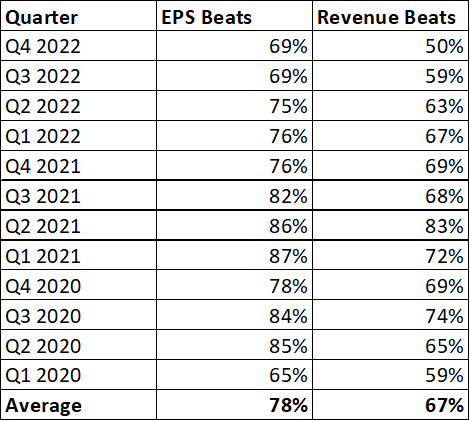
147 of the S&P 500 companies have released earnings so far. 50% have beat on top line expectations and 69% have beat on bottom line. The 50% beat rate, should it hold, would be the lowest top line rate since before the pandemic. Next week is a big earnings week and will give us more information on potential earnings recession. This information is tracked using MarketBeat.

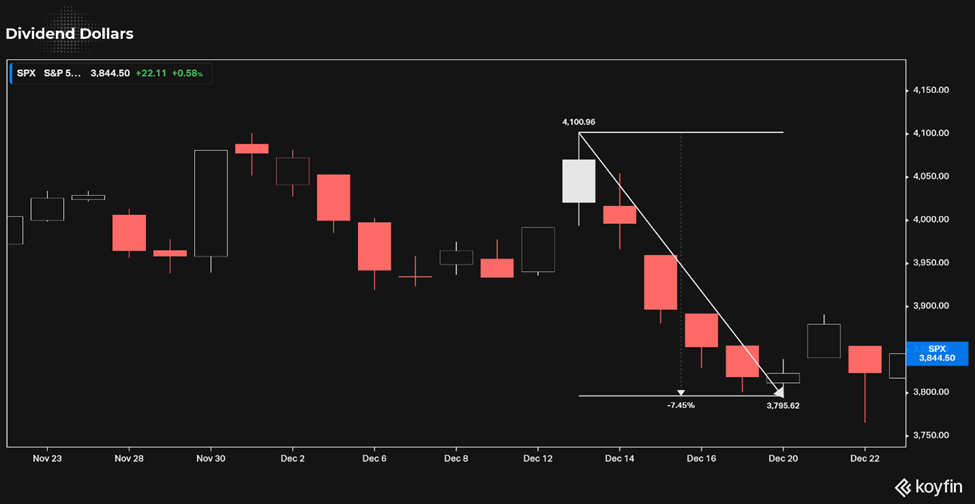
 The S&P chart has turned bullish as the market pushed above the downtrend and put some space between price and the SMA 200. We have had the highest number of daily closes above the 200 day SMA in 2023 so far since last spring. The next level I see is around 4,080 that has rejected three times.

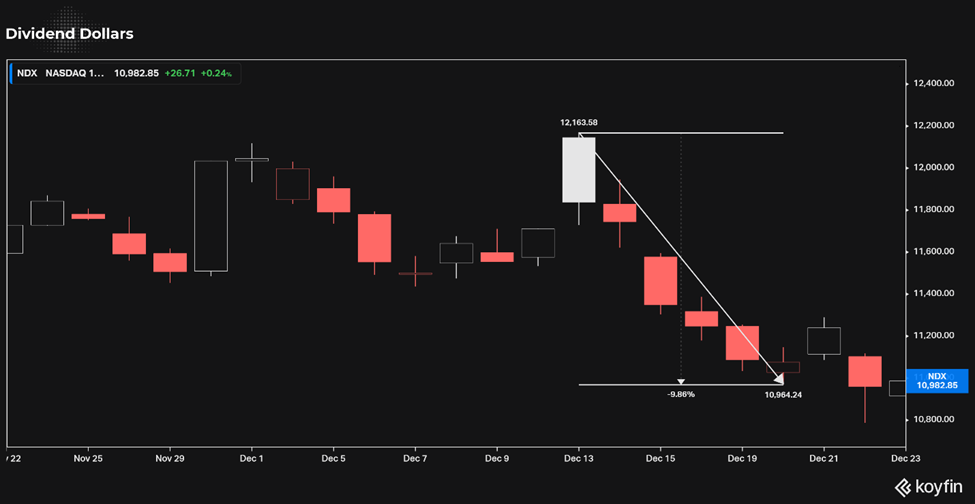
Similarly, the Nasdaq Composite index has a level a 11,617 to get over. It is also approaching the change to break above the 200 day SMA for the first time in a year. Additionally, the index is above is 11,500 resistance level. It looks bullish but the coming earnings from mega-cap tech names have the potential to move it.

Overall, stocks are riding recent bullish momentum and are being supported by technical developments. The market appears to be hopeful that the Fed will show a less aggressive stance on rates. We have seen this optimism in the past before, but we haven’t seen the Fed move into a stock friendly stance. Maybe that happens at the next meeting, maybe we get more information on potential rate hike path.

We will see what happens with the Fed next week and will have a better feel  of what’s going on in tech. With VIX as low as it is, a slurry of stocks reaching 52 week highs, decent earnings and data, the bulls appear to be in control for the near term. Potential for volatility next week is high. I think the market is moderately bullish in the first of the week then could be volatile in either direction depending on those factors.

That’s it for my recap! If you would like to see how I am building my dividend portfolio using my predictions/strategy written here, you can read about my buys in my weekly portfolio update on this link.

And if you like updates like this, follow my Twitter or my CommonStock page where I post updates on the economic data throughout the week.

Regards,

Dividend Dollars

Categories
Dividend Stocks Dividends Portfolio Stock Market

Dividend Portfolio: 1/27/2023 Weekly Update

Welcome back to the weekly Dividend Dollars portfolio review! This portfolio update is brought to you by Sharesight, a portfolio tracking tool that I am happy to partner with. Their platform makes tracking trading and dividend history, understanding your performance, and saving time a breeze. I wrote a review of the product that you can read here if you’re interested in learning more! Click the link above or the picture below to get a special offer only for Dividend Dollar readers!

Here at Dividend Dollars, our investing approach is a dividend growth strategy with aspects of value investing and fundamental analysis. I am a young investor in my 20’s and by sticking to this strategy over the long term, the magical powers of compounding are on my side. This allows me to more easily build substantial positions in dividend paying stocks over time, which will one day help me reach the ultimate goal of being financially free through the sources of passive income they provide. You can read more about the strategy here. Let’s dive into the portfolio review!

Portfolio Value

To date, I have invested $13,250 into the account the total value of all positions plus any cash on hand is $13,694.30. That’s a total gain of 3.35%. The account is up $228.72 for the week which is a 1.70% gain.

We started building this portfolio on 9/24/2021 and when compared to the S&P 500 we are outperforming the market so far! Within that same timeframe, the S&P 500 is down -8.64% which puts us 11.99% higher than the market! I love tracking my portfolio against a benchmark like the S&P. The above chart comes from Sharesight which makes portfolio and dividend management a breeze!

We added $120 in cash to the account this week, trades made will be broken out below.

Portfolio

Above is a dashboard of the portfolio that tracks annual dividend income, yield, beta, dividend growth, and more.

Below is a table of everything we are invested in so far. There you can see my number of shares, shares bought through dividend reinvestments, average cost, gains, and more. The tickers in green are positions that I bought shares in this week, the blue ones are positions that I reinvested dividends into, the yellow ones are positions that announced a dividend increase this week, and the red are positions that I trimmed. Our PADI this week decreased from $505 to $509. This is mainly because of a drop in the yearly payout from $XYLG following their most recent dividend declaration.

Dividends

This week I received two dividends. $4.06 from ETRACS 2x Monthly Levered ETN and $4.10 from Comcast.

In my portfolio, all positions have dividend reinvestment enabled. I don’t hold onto the dividend, I don’t try to time the reinvestment, I just let my broker do it automatically.

Dividends received for 2023: $23.04

Portfolio’s Lifetime Dividends: $433.44

Trades

This was a quite slow week for my portfolio. Except for the dip on Tuesday, the market rallied higher for most of the week. I’d much rather buy in more red weeks, so I did not spend too much time making buys. I executed our weekly ETF buys, reinvested all dividends, and did one opportunistic buy into $MSFT after their earnings.

Additionally, I sold a $T covered call going into the earnings, but second guessed it and closed it before the report. Boy am I glad I did! $T had a great earnings report and ran high enough to bring my position in the green for the first time since I began buying!

Below is a breakdown of the trades I made this week:

  • January 23rd, 2023
    • AT&T ($T) – sold $20.5 covered call 1/27 for $7 premium
  • January 24th, 2023
    • AT&T ($T) – bought to close $20.5 covered call at $8
  • January 25th, 2023
    • ETRACS 2x Monthly Pay Leveraged ATN – dividend reinvested
    • Microsoft ($MSFT) – added 0.25 shares at $231.40
  • January 27th, 2023
    • SPDR S&P 500 ETF ($SPY) – added $10 at $406.47 per share (weekly buy)
    • Global X S&P 500 Covered Call & Growth ETF ($XYLG) – added $10 at $26.42 per share (weekly buy)
    • Schwab US Dividend Equity ETF ($SCHD) – added $10 at $76.38 per share (weekly buy)

Next week I will continue to add $10 into each ETF ($SPY, $XYLG, and $SCHD) and will continue to hold onto some cash if the market gets lower. I have started to slowly deploy that cash in case a bottom has already been hit, but only time will tell. I really want to deploy this cash position into $CMCSA, and $INTC to build 100 share positions in them for covered call activities. I will also be watching $T for opportunities to sell covered calls.

Summary

That is it for the update this week. The market recap and outlook for this wild week will be posted on Saturday, so make sure to have the site bookmarked or subscribe via email on the homepage!

Let me know what you think of the progress so far, share with me your progress and questions, interact with me on twitter and Instagram using the links below!

Thank you for reading! See you next week and stay safe!

Regards,

Dividend Dollars

Categories
Earnings Economics Market Recap Market Update Stock Market

Stock Market Recap & Outlook (1/20/22) – PPI and Earnings Brings a Whipped Week

This weekly market recap is brought to you by Koyfin, a powerful analytical tool that I am proud to partner with. Their platform is entirely customizable for whatever data you want to look at including stocks, ETFs, mutual funds, currencies, economic data releases (one of my personal favorites used often for these posts), crypto, and even transcripts of company events! Click the link above to get a special offer only for Dividend Dollar readers or go give my product review a read if you’re interested!

Weekly Review

The 2023 rally hit a speedbump week as investors may have been looking to take some money off the table after the gains from the last two weeks. Growth and rate hike concerns, which had been put on the backburner to start the year, seemed to be back in play. 

Early on Wednesday, the market initially reacted positively to the slowdown in inflation reflected in the December Producer Price Index (PPI) of -0.5% that beat expectations by 0.4%. Any optimism that may have come from the pleasing PPI report quickly faded as weak retail sales and manufacturing data was released thereafter.

Retail sales fell 1.1% month-over-month in December compared to expectations of -0.8%. This comes off of a revised 1.0% fall in November.

Industrial production fell 0.7% month-over-month in December compared to a -0.1% expectation. This, also, comes off a revised decrease to 0.6% for November.

Following these releases, the main indices sold off on Wednesday. Selling efforts had the S&P 500 take out support at its 200-day moving average. It could be argued that data is suggesting that the Fed is likely to remain on its rate hike path in spite of a weakening economic backdrop, increasing the risk for a policy mistake to trigger a deeper setback and therefor increasing the selling efforts.

Market participants also received official commentary on the economy when the FOMC released its latest Beige Book on Wednesday afternoon. “On balance, contacts generally expected little growth in the months ahead.”

St. Louis Fed President Bullard (non-FOMC voter) added fueled the market’s concerns saying that he would prefer that the Fed stay on a more aggressive path but added that the prospects for a soft landing have improved.

Thursday’s trade, a mostly choppy and sideways day, looked a lot like Wednesday’s trade with investors reacting to more data and commentary pointing towards weakening growth and the possibility of the Fed making a policy mistake.

Building permits decreased for the third consecutive month in December to 1.330 million. One surprising positive note out of the report was that single-family starts grew 11.3% month-over-month.

Weekly initial claims were released at the same time, which decreased to 190,000, their lowest level since late September. There are no major weaknesses in the labor market that could put a stop to the Fed’s hiking path.

JPMorgan Chase CEO Jamie Dimon said in an interview Thursday morning “I think there’s a lot of underlying inflation, which won’t go away so quick,” adding that he thinks rates will top 5.0%.

As earnings season progresses, the main concern for the market is the potential that weaker growth will translate to cuts in earnings estimates and downward guidance.

Goldman Sachs ($GS) sold off sharply on Tuesday after reporting below-consensus earnings (Actual EPS 3.32 vs 5.77 Average Estimate) and revenue (Actual 10.59B vs 10.91 Average Estimate), along with increased provisions for credit losses.

So far, however, quarterly results have generally received positive reactions from investors. In contrast to Goldman Sachs, Morgan Stanley ($MS) received a positive reaction despite a Q4 earnings miss.

Another notable earnings report was Netflix ($NFLX), which surged 8.5% on Friday and led to interest in the tech/growth space. It felt like this pushed a sentiment shift and produced the rally effort on Friday.

The rebound effort to close out the week had the Nasdaq Composite recoup all of its losses while the S&P 500 and Dow Jones Industrial Average put a nice dent in their weekly losses. The S&P 500 was able to climb back above its 200-day moving average by Friday’s close.

Only three S&P 500 sectors were green this week — communication services (+3.0%), energy (+0.7%), and information technology (+0.7%) — while the industrials (-3.4%), utilities (-2.9%), and consumer staples (-2.9%) sectors had the largest losses.

The 2-yr Treasury note yield fell two basis points this week to 4.20% and the 10-yr note yield fell three basis points to 3.48%. The U.S. Dollar Index fell 0.2% to 101.99.

WTI crude oil futures rose 2.3% to $81.69/bbl and natural gas futures fell 5.3% to $3.03/mmbtu.

Separately, Treasury Secretary Yellen notified Congress via a letter that the debt ceiling has been reached, prompting the Treasury Department to begin employing extraordinary measures.

Dividend Dollars’ Outlook & Opinion

That’s it for the recap. Now for my opinion!

As I mentioned in the last market update, I predicted a red week this week but that we wouldn’t break below the 100 day SMA. I was correct, but I was not expecting a rally as strong as we got on Friday. After rejecting against the downtrend line and falling under it, we only stayed there for a day before trying again. Truly some wild price action!

My main reason for predicting this is due to my assumption that quarterly earnings this season will show slowing growth. Earnings so far has been mixed, but that slowing growth is starting to as we get deeping into this earnings season. This week 26 companies in the S&P 500 reporting earnings, 15 of them beat consensus EPS expectations. 55 companies of the 500 have reported Q4 results so far and have beaten EPS 69% of the time and revenue estimated 55% of the time.

Year over year, Q4 earnings are -4.5% lower versus a -4.1% estimated from Schwab Managing Director of Trading and Derivatives. Revenues are +7.4% higher year over year versus a 3.8% estimate.

Though there was lots to talk about, this week was a moderate week for economic data materially. The key was the inflation report in PPI which eased quite a bit, it pushed the market higher very briefly before falling down sharply. A slowdown in inflation should be great news for markets since it means the Fed’s rate hikes are having effects. So that brief downturn (and the sideways movement following the CPI) doesn’t make much sense to me, unless you believe inflation expectations were already baked in.

So I believe the movement was mainly a technical one as we rejected hard off the strong downtrend line. After pushing higher through the 50 day SMA last week (dark blue line), the market stalled at the convergence of the 200 day SMA (white line) and the downtrend. The market has failed to break above that line 5 times now.

Given how firmly that line has held, I believe a significant breakthrough above it will be needed before the beginning of the next longer-term uptrend. And next week could be the deciding week for that! Next week is the biggest week for earnings in this earnings season so far.

SPX open interest change for the past week was larger to the put site (call OI +3.0% and put OI +4.4%) as was the aggregate changes in exchange traded products (includes SPY, QQQ, DIA, etc.). This could be interpreted to be bearish. However, open interest participation as a whole is +19.2% greater than 2022 levels which may be bullish for the long term. VIX levels seem neutral in the near-term, however, the VIX IV Gap is lower is moderately bullish.

Price action through Wednesday should be mostly indicative of only earnings releases as there are no noteworthy economic reports through then and the indicators mentioned above are a bit mixed. Thursday brings us the first estimate of GDP for Q4 and durable goods orders for December, both of which can cause a market reaction. Then Friday does a one up and brings us the Core PCE reading for December and a sentiment report for January.

This PCE report is about the only item left that could affect the outcome of the next Fed rate hike, which I predict to be 0.25%, but those results would have to be extremely significant to even put a 0.50% rate hike on the table.

I’m thinking risk off continues into next week after a possible brief approach up to the downtrend line again followed by a rejection down. However, be ready flip sides if earnings beats are common next week as that may be push strong enough to break above. And if we break above its off to the races.

That’s it for my recap! If you would like to see how I am building my dividend portfolio using my predictions/strategy written here, you can read about my buys in my weekly portfolio update on this link.

And if you like updates like this, follow my Twitter or my CommonStock page where I post updates on the economic data throughout the week.

Regards,

Dividend Dollars

Categories
Dividend Stocks Dividends Portfolio Stock Market

Dividend Portfolio: 1/20/2023 Weekly Update

Welcome back to the weekly Dividend Dollars portfolio review! This portfolio update is brought to you by Sharesight, a portfolio tracking tool that I am happy to partner with. Their platform makes tracking trading and dividend history, understanding your performance, and saving time a breeze. I wrote a review of the product that you can read here if you’re interested in learning more! Click the link above or the picture below to get a special offer only for Dividend Dollar readers!

Here at Dividend Dollars, our investing approach is a dividend growth strategy with aspects of value investing and fundamental analysis. I am a young investor in my 20’s and by sticking to this strategy over the long term, the magical powers of compounding are on my side. This allows me to more easily build substantial positions in dividend paying stocks over time, which will one day help me reach the ultimate goal of being financially free through the sources of passive income they provide. You can read more about the strategy here. Let’s dive into the portfolio review!

Portfolio Value

To date, I have invested $13,130 into the account the total value of all positions plus any cash on hand is $13,332.90. That’s a total gain of 1.55%. The account is down $233.43 for the week which is a 1.72% loss.

We started building this portfolio on 9/24/2021 and when compared to the S&P 500 we are outperforming the market so far! Within that same timeframe, the S&P 500 is down -10.84% which puts us 12.39% higher than the market! I love tracking my portfolio against a benchmark like the S&P. The above chart comes from Sharesight which makes portfolio and dividend management a breeze!

We added $120 in cash to the account this week, trades made will be broken out below.

Portfolio

Above is a dashboard of the portfolio that tracks annual dividend income, yield, beta, dividend growth, and more.

Below is a table of everything we are invested in so far. There you can see my number of shares, shares bought through dividend reinvestments, average cost, gains, and more. The tickers in green are positions that I bought shares in this week, the blue ones are positions that I reinvested dividends into, the yellow ones are positions that announced a dividend increase this week, and the red are positions that I trimmed. Our PADI this week decreased from $500 to $505. This is mainly because of a drop in the yearly payout from $XYLG following their most recent dividend declaration.

Dividends

This week I received no dividend, bummer!

In my portfolio, all positions have dividend reinvestment enabled. I don’t hold onto the dividend, I don’t try to time the reinvestment, I just let my broker do it automatically.

Dividends received for 2023: $14.88

Portfolio’s Lifetime Dividends: $425.28

Trades

This was quite a busy week with a large mid-week dip that I took advantage of followed by a sweet two-day rally to leave the market and my portfolio significantly higher.

I made lots of buys in the portfolio on the down-day Wednesday and then a little more on Thursday. Firstly, we initiated a new position in Orsted (which I wrote a brief article on how they are poised to be a huge renewable power player in the North Sea, you can read that here), add to my favorite DCA’s of ALLY, INTC, and BAC, and also executed our weekly $10 adds in SPY, XYLG, & SCHD.

Lastly, my first covered call on AT&T expired worthless this week giving me a 100% gain on that premium. I will be watching their earnings call next week and will be looking for a spot to write another.

Below is a breakdown of the trades I made this week:

  • January 17th, 2023
    • Orsted ($DNNGY) – added 3 shares at $34.17
  • January 18th, 2023
    • Microsoft ($MSFT) – added 0.14 shares at $240.79
    • Ally Financial ($ALLY) – added 3 shares at 26.84
    • Bank of America ($BAC) – added 2 shares at $33.72
    • Intel ($INTC) – added 2 shares at $28.77
    • SPDR S&P 500 ETF ($SPY) – added $10 at $394.45 per share (weekly buy)
    • Global X S&P 500 Covered Call & Growth ETF ($XYLG) – added $10 at $25.88 per share (weekly buy)
    • Schwab US Dividend Equity ETF ($SCHD) – added $10 at $76.39 per share (weekly buy)
  • January 19th, 2023
    • Ally Financial ($ALLY) – added 1 share at $25.70
    • Intel ($INTC) – added 1 share at $28.34
    • 3M ($MMM) – added 0.5 shares at $120.20
  • January 20th, 2023
    • Orsted ($SNNGY) – added 1 share at $29.73
    • AT&T ($T) – $20 Covered Call expired, 100% on $3 premium

Next week I will continue to add $10 into each ETF ($SPY, $XYLG, and $SCHD) and will continue to hold onto the rest of my cash if the market gets lower. I have started to slowly deploy that cash in case a bottom has already been hit, but only time will tell. I really want to deploy this cash position into $CMCSA, and $INTC to build 100 share positions in them for covered call activities.

Summary

That is it for the update this week. The market recap and outlook for this wild week will be posted on Saturday, so make sure to have the site bookmarked or subscribe via email on the homepage!

Let me know what you think of the progress so far, share with me your progress and questions, interact with me on twitter and Instagram using the links below!

Thank you for reading! See you next week and stay safe!

Regards,

Dividend Dollars

Categories
Earnings Economics Market Recap Market Update Stock Market

Stock Market Recap & Outlook (1/13/22) – CPI Report & Q4 Earnings Kicks Off

Apologies for missing the review last week, travel makes it hard! We are back and don’t have any more plans for a little while, so writing mode is fully engaged!

Anyways, this weekly market recap is brought to you by Koyfin, a powerful analytical tool that I am proud to partner with. Their platform is entirely customizable for whatever data you want to look at including stocks, ETFs, mutual funds, currencies, economic data releases (one of my personal favorites used often for these posts), crypto, and even transcripts of company events! Click the link above to get a special offer only for Dividend Dollar readers or go give my product review a read if you’re interested!

Weekly Review

The stock market decided to keep the heat on high for the second week of 2023. We logged decent gains on the basis that the Fed won’t have to raise rates as much as feared and that the U.S. economy may see a “soft landing” after all.

The first half of the week was a snooze-fest, as most traders were waiting for Fed Chair Powell’s speech on Tuesday, the December Consumer Price Index (CPI) on Thursday, and bank earnings reports on Friday that marked the official start to the Q4 earnings reporting season.

Fed Chair Powell gave a speech titled “Central Bank Independence” Tuesday morning. Powell’s speech made no mention of any kind of policy that would harm markets, he did, however, acknowledge that, “…restoring price stability when inflation is high can require measures that are not popular in the short term as we raise rates to slow the economy.”

The latter point notwithstanding, the S&P 500 was able to close above technical resistance at its 50-day moving average.

By Thursday’s open, the market had received the much anticipated CPI report. It was in-line with the market’s hopeful expectations that it would show continued disinflation in total CPI (from 7.1% year/year to 6.5%) and core CPI (from 6.0% year/year to 5.7%).

Those were pleasing headline numbers, but it is worth noting that services inflation, which the Fed watches closely, did not improve and rose to 7.5% year/year from 7.2% in November.

That understanding did not seem to hold back the stock or bond market. After a brief dip, the price action on Thursday generally supported the view that the Fed will pause its rate hikes sooner rather than later. In fact, the fed funds futures market now prices in a 67.0% probability of the target range for the fed funds rate peaking at 4.75-5.00% in May versus 55.2% a week ago, according to the CME FedWatch Tool.

The move up in the stock market was particularly notable considering the big move leading up to the CPI report. The S&P 500 was up 3.7% for the year entering Thursday and up 4.4% from its low of 3,802 on January 5.

Ahead of the open on Friday, the market gave back some gains and featured a series of mixed quarterly earnings from Bank of America ($BAC), JPMorgan Chase ($JPM), Wells Fargo ($WFC), and Citigroup ($C). Those stocks languished out of the gate due to higher-than-expected credit loss provisions. But true to form for 2023 so far, buyers returned and bought the weakness. Before long the bank stocks were back in positive territory and so was the broader market.

The S&P 500 moved above its 200-day moving average (3,981) on the rebound trade and closed the week a whisker shy of 4,000.

Only one of the S&P 500 sectors closed with a loss this week: consumer defensive (-0.74%) — while the heavily weighted consumer cyclical (+5.94%) and information technology (+5.58%) sectors logged the biggest gains.

The 2-yr Treasury note yield fell five basis points to 4.22% and the 10-yr note yield fell six basis points to 3.51%. The U.S. Dollar Index fell 1.6% this week to 102.18.

WTI crude oil futures made strides to the upside this week rising 8.5% to $80.06/bbl. Natural gas futures fell 4.8% to $3.23/mmbtu.

Dividend Dollars’ Opinion

That’s it for the recap. Now for my opinion!

As I mentioned in the last market update, after basing around the 3,825 level for a while, the next move was a significant one. I expected that dip buyers would step in with tax loss harvesting over, earnings season approaching, and the next rate hike still a few weeks away.

I said, “they could push the market higher for next week, or even the week after that” and that’s exactly what’s happened! The January Effect is in full swing. Last week I was correct in not expecting any major move in one direction or the other.

I predicted a short-term bounce before drawbacks are caused by possible earnings disappointments, the next rate hikes, and key economic data misses. We saw this week that two of those items are losing steam.

The CPI report showed that falling inflation is confirmed, but not overly impressive.

Then, the banks kicked off earnings. Even though they beat expectations, their results were a mixed bag. But weren’t enough to push the market lower. Many more key earnings are to come, but if the banks were any indication, this earnings season may not be the “make it or break it season”.

So far, 6% of companies in the S&P 500 have reported Q4 results with an 86% beat on EPS and 57% beat on revenue. The earnings so far show 4% growth on a year-over-year basis compared to a -4.1% estimated when Q4 ended. The season is still early, so let’s not extrapolate on these results too much. Rather, lets look at the technicals!

A lot has changed since the last time we did weekly update. The bear market low is still intact and 4,292 is the target for a new bull market to start. These two items are now -10% and +8% away from the current level.

For weeks I have been pointing out the resistance at the 50-day SMA (dark blue line) and the 100-day SMA (light blue line), the market finally broke above them. It did not take long for the next level, the 200-day SMA (white line), to come into play. Our last daily candle still encompasses the line, which is not yet a clean break. This line also converges with long-term downtrend area that began at the last all time high. The prior four failures at this level suggests it won’t be easy to break.

I think we have seen the short-term bounce that I last wrote about. This resistance we are heading into is the mother-of-all-resistance! Bargain buyers came in strong in the first two weeks of 2023, but steam may run out soon if earnings season disappoints and resistance proves heavy. I wouldn’t be surprised to see profit taking, and a red week next week, but I don’t believe we will fall under the 100 SMA now turned support.

That’s it for my recap! If you would like to see how I am building my dividend portfolio using my predictions/strategy written here, you can read about my buys in my weekly portfolio update on this link.

And if you like updates like this, follow my Twitter or my CommonStock page where I post updates on the economic data throughout the week.

Regards,

Dividend Dollars

Categories
Economics Market Recap Market Update Stock Market

Stock Market Week in Review (12/30/22) – 2022 End Without a Bang

This weekly market recap is brought to you by Koyfin, a powerful analytical tool that I am proud to partner with. Their platform is entirely customizable for whatever data you want to look at including stocks, ETFs, mutual funds, currencies, economic data releases (one of my personal favorites used often for these posts), crypto, and even transcripts of company events! Click the link above to get a special offer only for Dividend Dollar readers or go give my product review a read if you’re interested!

Weekly Review

The last week of 2022 shaped up to be a disappointing one, similar to the whole of the year. With all the major indices finishing the year off quite lower than where they started. The S&P 500 ended down 18.2%, The Nasdaq 100 ended down 33.6%, and the Dow Jones Industrials ended down 8.6% .

The Santa Clause Rally never really seemed to kick off and Q3 earnings season is now over, with the next not starting for about two more weeks.

The major indices remained under pressure from continued weakness in some of the most beaten-up names this year. Specifically, mega cap losses accelerated this week on lingering valuation concerns and presumably tax-loss selling activity by participants who bought into the seemingly invincible stocks last year.

Some of the mega cap names aren’t so “mega” any more given the massive loss in market capitalization they have suffered this year. The Vanguard Mega Cap Growth ETF $MGK fell  0.3% this week and 34.0% for the year.

The Santa Claus rally period, which is the last five trading days of the year and the first two trading sessions of the new year, has gotten off to an uneven start. It is believed to be a good sign for how the new year will start when this period produces a cumulative gain over that stretch. 2022 was a definite exception to that belief. Recall that the 2021 Santa Claus rally produced a net gain of 1.4% for the S&P 500 and yet the S&P 500 declined 5.3% this January and 5.0% in the first quarter.

It looked like Santa Claus might come charging to town following Thursday’s rally. The S&P 500 closed the session just a whisker below the 3,850 level, where it has remained since mid-December, but then backed off again in Friday’s trade.

When this year’s Santa Claus rally period began, the S&P 500 stood at 3,822.39. The S&P 500 closed Friday’s session at 3839.50 after visiting the 3,800 level.

It was also a disappointing week in the Treasury market. The 2-yr note yield rose 10 basis points to 4.42% and the 10-yr note yield rose 13 basis points to 3.88%.

The bump in yields was another headwind for equities, particularly the growth stocks, which was the case all year. The Russell 3000 Growth Index fell 0.3% this week, and 29.6% for the year, versus the Russell 3000 Value Index which rose 0.1% this week and fell 10.1% for the year.

Separately, Southwest Air $LUV was an individual story stock of note after the airline canceled thousands of flights due to the winter storm. Tesla $TSLA was another focal point, trading in roller-coaster fashion. The stock hit 108.76 at its low on Tuesday, leaving it down 69.0% for the year, but managed to rebound and hit a high of 124.48 in Friday’s trade.

Only 3 of the 11 S&P 500 sectors closed with a gain this week in thin trading conditions. The financials sector rose 0.74%, the energy sector rose 0.47%, aided by a bump in oil prices above $80.00/bbl, and the communication sector rose 0.40%. Meanwhile, the materials and consumer staples sectors were the worst performers with losses of 1.07% and 0.84%, respectively.

The economic calendar was light on major releases this week. Featured reports included the November Pending Home Sale Index, which declined 4.0%, and continuing jobless claims for the week ending December 17, which hit their highest level since February (1.710 million). Next week will see many major releases that includes the December ISM Manufacturing Index, the December Employment Situation Report, and the December ISM Non-Manufacturing Index.

Dividend Dollars’ Opinion

That’s it for the recap. Now for my opinion!

Last week I was correct in not expecting any major move in one direction or the other. The SPX ended only 6 points lower this week than where it ended last week!

It appears that the Bear Market level is being confirmed as a key level of resistance. And with all major moving averages above the that level, there is not much happening in form of support below our level.

We have been basing at this level for 8 days, which makes me think the next move in either direction will be a significant one.

With the next earnings season still two weeks away and the next rate hike still about four weeks away, the dip buyers are likely to step in again, now that the tax-loss harvesting season has ended. Most people like to buy things when they are on sale, and right now the SPX is 20% off.

Data releases on the ISM Index and Unemployment next week could be the items that have the largest impact.

January will be the month the watch for next year. Given the end of tax-loss harvesting and the fact that we are a few weeks away from key economic data releases and the next Fed hike, I think bargain buyers could push the market higher for next week, or even the week after that putting the January Effect in full swing.

The January Barometer also shows that January overall will be the month to watch. The barometer is: If the Standard & Poor’s 500 market index ends January higher than it started, the rest of the year will follow suit, and vice versa. the January Barometer has registered only 11 errors between 1950 and 2021, giving the indicator an accuracy ratio of 84.5%.

With all of that in mind, I think we see a short-term bounce before possible drawbacks caused by earnings disappointments, Fed hike, and other key economic data bring the market down to a lower level in January.

That’s it for my recap! If you would like to see how I am building my dividend portfolio using my predictions/strategy written here, you can read about my buys in my weekly portfolio update on this link.

And if you like updates like this, follow my Twitter or my CommonStock page where I post updates on the economic data throughout the week.

Regards,

Dividend Dollars

Categories
Dividend Stocks Dividends Portfolio Stock Market

Dividend Portfolio: 12/23/2022 Weekly Update

Welcome back to the weekly Dividend Dollars portfolio review! This portfolio update is brought to you by Sharesight, a portfolio tracking tool that I am happy to partner with. Their platform makes tracking trading and dividend history, understanding your performance, and saving time a breeze. I wrote a review of the product that you can read here if you’re interested in learning more! Click the link above or the picture below to get a special offer only for Dividend Dollar readers!

Here at Dividend Dollars, our investing approach is a dividend growth strategy with aspects of value investing and fundamental analysis. I am a young investor in my 20’s and by sticking to this strategy over the long term, the magical powers of compounding are on my side. This allows me to more easily build substantial positions in dividend paying stocks over time, which will one day help me reach the ultimate goal of being financially free through the sources of passive income they provide. You can read more about the strategy here. Let’s dive into the portfolio review!

Portfolio Value

To date, I have invested $12,770 into the account the total value of all positions plus any cash on hand is $12,593.26. That’s a total loss of 1.38%. The account is up $8.20 for the week which is a 0.06% gain. Pretty flat week.

We started building this portfolio on 9/24/2021 and when compared to the S&P 500 we are outperforming the market so far! Within that same timeframe, the S&P 500 is down -13.71% which puts us 12% higher than the market! I love tracking my portfolio against a benchmark like the S&P. The above chart comes from Sharesight which makes portfolio and dividend management a breeze!

We added $60 in cash to the account this week, trades made will be broken out below.

Portfolio

Above is a dashboard of the portfolio that tracks annual dividend income, yield, beta, dividend growth, and more.

Below is a table of everything we are invested in so far. There you can see my number of shares, shares bought through dividend reinvestments, average cost, gains, and more. The tickers in green are positions that I bought shares in this week, the blue ones are positions that I reinvested dividends into, the yellow ones are positions that announced a dividend increase this week, and the red are positions that I trimmed. Our moves this week increased my PADI by $9 to $491.

Dividends

This week I received only 1 dividend for $2.21 from $SMHB.

In my portfolio, all positions have dividend reinvestment enabled. I don’t hold onto the dividend, I don’t try to time the reinvestment, I just let my broker do it automatically.

Dividends received for 2022: $377.90

Portfolio’s Lifetime Dividends: $400.83

Trades

This week was mainly a DCA week was a slow one. I took the opportunity average down a little in AT&T and pick up some shares in Medtronic right before the ex-dividend date. Most other activity was my weekly buys in $SPY, $XYLG, and $SCHD as well as reinvesting dividends.

Below is a breakdown of the trades I made this week:

  • December 19th, 2022
    • SPDR S&P 500 ETF ($SPY) – added $10 at $383.54 per share (weekly buy)
    • Global X S&P 500 Covered Call & Growth ETF ($XYLG) – added $10 at $25.30 per share (weekly buy)
    • Schwab US Dividend Equity ETF ($SCHD) – added $10 at $75.14 per share (weekly buy)
    • AT&T ($T) – added 2 shares at $18.13
    • Medtronic ($MDT) – added 2 shares at $76.73
  • December 20th, 2022
    • Realty Income ($O) – added 1 share at $63.46
  • December 21st, 2022
    • ETRACS 2x Levered ETN ($SMHB) – dividend reinvested

Next week I will continue to add $10 into each ETF ($SPY, $XYLG, and $SCHD) and will continue to hold onto the rest of my cash. I really want to deploy this cash position into $T, $CMCSA, and $INTC to build 100 share positions in them for covered call activities.

Summary

That is it for the update this week. Let’s kill it next week. Stay patient and be ready to buy income producing assets at a discount!

Read the weekly market review to get a recap of the week and help arm yourself with market knowledge! There’s tons to discuss with the latest FOMC meeting and economic data releases, so go give it a read!

Let me know what you think of the progress so far, share with me your progress and questions, interact with me on twitter and Instagram using the links below!

Thank you for reading! See you next week and stay safe!

Regards,

Dividend Dollars

Categories
Economics Market Recap Market Update Stock Market Strategy

Stock Market Week in Review (12/23/22) – A Weak Week to Lead Us Into The “Santa Rally”

This weekly market recap is brought to you by Koyfin, a powerful analytical tool that I am proud to partner with. Their platform is entirely customizable for whatever data you want to look at including stocks, ETFs, mutual funds, currencies, economic data releases (one of my personal favorites used often for these posts), crypto, and even transcripts of company events! Click the link above to get a special offer only for Dividend Dollar readers or go give my product review a read if you’re interested!

Weekly Review

Well, this was a disappointing week, and one that solidifies the absence of a Santa Clause Rally to end the year. The S&P 500, which touched 4,100 last Tuesday, was drawn to the 3,800 level all week which proved to be a key support area.

With tax loss harvesting likely to be beginning and with sentiment falling over all due to 2023 earnings estimates feeling too high, the market was lower this week. Many analysts suggest downward earnings revisions in the coming weeks and months as the economic environment shifts.

The week started on a weaker note as the market digested a weaker-than-expected NAHB Housing Market Index report for December on Monday.

Treasury markets moved on a surprise policy change from the Bank of Japan (BOJ) on Tuesday. The BOJ announced a change to its yield curve control (YCC) policy to allow the 10-yr JGB yield to move +/- 50 basis points from 0.00% versus its prior band of +/- 25 basis points as part of an effort “to improve market functioning.”

This announcement, which came in conjunction with the BOJ’s decision to leave its benchmark rate unchanged at -0.1%, also caused some upheaval for the Nikkei (-2.5%) on Tuesday and the currency market in addition to sovereign bond markets. The yen surged as much as 4.0% against the dollar.

The Market also had to deal with some disappointing housing data before Tuesday’s open, namely an 11.2% month-over-month decline in November building permits (a leading indicator) to a seasonally adjusted annual rate of 1.342 million (consensus 1.480 million).

The S&P 500 dropped below 3,800, scraping 3,795 at Tuesday’s low before buyers showed up for a small rebound effort that ultimately left the main indices with modest gains. At this point, the indices were in a short-term oversold position. At their lows Tuesday morning, the Nasdaq Composite and S&P 500 were down 9.7% and 7.5%, respectively, from their highs last week. That oversold posture triggered some speculative buying interest in a bounce.

Things really took off Wednesday when some well-received earnings reports from Dow component Nike ($NKE) and leading transport company FedEx ($FDX) triggered some decent buying interest.

The market also got some better-than-expected consumer confidence data for December, which was another support factor for the broader market. That report overshadowed a weaker than expected existing home sales report for November that was released at the same time.

Unfortunately, the rebound move soured promptly on Thursday following some disappointing earnings results and commentary from Micron ($MU) and CarMax ($KMX), a sour Leading Economic Indicators report, and some cautious-sounding remarks from influential hedge fund manager David Tepper say he is ‘leaning short’ on the stock market.

He expects the Fed and other central banks to keep tightening and for rates to remain high for a while, making it “difficult for things to go up.” His comments resonated with market participants who recalled the hugely successful “Tepper Bottom” call he made in March 2009.

The resulting retreat was broad in nature with the major indices moving noticeably lower right out of the gate, dealing as well with rate hike concerns after the third estimate for Q3 GDP showed an upward revision to 3.2% from 2.9%. The Nasdaq, S&P 500, and Dow were down 3.7%, 2.9%, and 2.4%, respectively, at Thursday’s lows.

The S&P 500 was stuck below the 3,800 level and Tuesday’s low (3,795) for most of the session before the main indices managed to regain some of their losses in the afternoon trade. There was no specific news catalyst to account for the bounce, possibly just speculative bargain hunting.

Friday’s session also started on a downbeat note after the November Personal Income and Spending Report showed no growth in real spending and PCE and core-PCE inflation rates that are still too high on a year-over-year basis (5.5% and 4.7%, respectively) for the Fed’s liking.

This report meshed with a Durable Goods Orders Report for November that was weaker than expected and was subsequently followed by economic data that showed new home sales were stronger than expected in November and that easing inflation pressures helped boost consumer sentiment in December.

Once again, the S&P 500 slipped below the 3,800 level, but soon found support as the new home sales and consumer sentiment data bolstered investor sentiment and spurred some bargain hunting interest. The major indices finished modestly higher on Friday, taking a positive first step during the Santa Claus rally period (last five trading days of the year plus the first two trading sessions of the new year).

Separately, the week concluded with the House passing the $1.7 trillion government funding bill after the Senate passed it, leaving it to be signed by the president early next week.

Overall, sector performance was mixed this week with 6 of the 11 sectors in the S&P ending green. Energy, financials, utilities, and a few others finished higher. The weakest links were consumer discretionary and technology which were dragged down by their mega cap components.

Dividend Dollars’ Opinion

That’s it for the recap. Now for my opinion!

Last week I was half-way right in expecting a near term bounce, however I was not expecting it to only last two days (Tuesday and Wednesday). We broke back under the bear market line and stayed there Thursday through Friday.

This here is the key to me. We are under all major moving averages AND the bear market line. There is significantly more resistance than there is support.

Next week, the 3,800 level will be key. We found substantial support at that level as everything under it was just a long wick. There are no major economic releases next week, which make me think we won’t see any crazy catalytic moves in one direction or the other.

We have some claims and housing reports, but that’s about all that’s worth watching, domestically that is. China and Japan have some releases that could bleed over into the US market.

With that, I will just reiterate what I said last week: “With the next earnings season on the way, Fed commentary continuing to spark volatility, and mixed economic data, the next move is anybody’s guess. I think a near-term bounce is likely with more downside to follow after the new year. Then, January will be the month to watch as history shows that it sets the market’s mood for the rest of the year.”

I think the action we saw on Tuesday and Wednesday very well could be the bounce, leaving more downside as my expectation. There are no huge economic releases next week, the Santa Rally so far has been week, therefore I think next week will be red mostly off of tax-loss harvesting.

However, if we open significantly higher in the earlier days of next week, I could see buyers coming in heavy off of the hopes of a strong Santa Rally to push us up through the end of the year. I think this scenario is less likely.

I would love to see more red next week so that I can buy more discounted stocks like I did this week. You can read about my buys in my weekly portfolio update here.

And if you like updates like this, follow my Twitter or my CommonStock page where I post updates on the economic data throughout the week.

Regards,

Dividend Dollars

Categories
Economics Market Update Stock Market

Stock Market Week in Review (12/16/22) – CPI and Fed Meeting

This weekly market recap is brought to you by Koyfin, a powerful analytical tool that I am proud to partner with. Their platform is entirely customizable for whatever data you want to look at including stocks, ETFs, mutual funds, currencies, economic data releases (one of my personal favorites used often for these posts), crypto, and even transcripts of company events! Click the link above to get a special offer only for Dividend Dollar readers or go give my product review a read if you’re interested!

Weekly Review

The week started strong after last week’s losses then quickly stagnated a fell as we awaited and then reacted the CPI release and FOMC policy decision in the mid-week.

Some merger and acquisition activity helped to fuel the early positivity in the week. We saw Amgen ($AMGN) acquire Horizon Pharmaceuticals ($HZNP) for $116.50 per share and Thoma Bravo acquire Coupa Software ($COUP) for $81.00 per share.

Then, the Consumer Price Index (CPI) release for November came in lower than anticipated which encouraged market upside based on the idea that a moderation in inflation should convince the Fed to slow the pace of its rate hikes. Or even place a lower ceiling on its terminal rate.

This pushed the S&P above its 200-day moving average. The Dow was up 2.1% at intraday highs on Tuesday and Nasdaq 3.8%. Those gains were eventually reined in and closed well off of the highs.

A deeper look at the CPI reading shows sticky and elevated core services in front of the FOMC rate decision to follow the next day. The major indices regroup in premarket trading on Wednesday and made some gains leading up to the FOMC announcement.

The Fed announced a 50 basis point raise to 4.25-4.50% and indicated in their Summary of Economic Projections that their median estimates for the terminal rate in 2023 and their expectations for inflation had risen. The vote to raise the fed funds rate was unanimous. The below dot plot shows 17 of the 19 Fed officials forecast a rate above 5% in 2023.

Separately, there was another announcement that the Fed would continue to let $60 billion of Treasury securities and $35 billion of agency mortgage-backed securities fall off the balance sheet each month.

Fed Chair Powell spent most of his press conference being stern on committing to 2% inflation, saying that it is going to take substantially more evidence to give confidence that inflation is on a downward path and the Fed expects to sit at its terminal rate for some time. He confirmed that we are close to level of tightening needed, but the Fed’s focus is not on rate cuts, which we can see is the case in the Economic Projections.

Overall, the Fed was much more hawkish than what the market expected. The indices faded into close on Wednesday and saw continued selling over the remainder of the week pushed by larger concern that the Fed could overtighten and trigger a deeper economic slowdown.

Thursday saw a slurry of rate hikes from other central banks across the world. The ECB, Bank of England, Swiss National Bank, Hong Kong’s Monetary Authority, and the Norges Bank all raised their benchmark rates. These hikes occurred at the same time that we received updated retail data and industrial production data out of the US and China. Both items grew concerns of global economic slowdown.

The S&P, Dow, and Nasdaq fell 99, 764, and 360 points respectively during Thursday’s freefall. Events this week showed that projections for 2023 earnings are at greater risk of downward revisions and stock prices are adjusting. The same mentality occurred on Friday with a quadruple witching day. There was broad based selling in the market and a number of moving average supports were broken.

Overall, the S&P fell 5% from where it was prior to the FOMC decision on Wednesday to where it closed on Friday. 10 of the 11 sectors in the S&P were red this week with consumer discretionary, materials, and communication services faring the worst, meanwhile the energy sector was the lone green close.

Dividend Dollars’ Opinion

That’s it for the recap. Now for my opinion!

Last week I was almost spot on with my expectations and main takeaways. I said that the CPI release and the FOMC meeting could provide huge volatility in the market, and it did. In both ways too. The market was up over 1.4% on Monday leading up to the report and another 7% on Tuesday after the report. Then the FOMC projections and meeting minutes were released, and the hawkish Fed scared the market into breaking down below a number of key moving averages.

Last week, I spoke about the straddle between the 100 and 200 SMAs and a break above could end at the trendline. Monday and Tuesday did just this when riding on the coattails of the positive CPI report. Then I spoke about how a breakdown under the 100SMA and we could see a quick drop to the 3,815 area as a gap fill.

Much to my surprise, BOTH of those situations played out. The Fed meeting showed that a majority of members raised their expectation of the terminal rate and the raised their average expected inflation rates for the next two years. This shook the markets, causing a drop from $4,020 to $3,830 in three days. Pretty dang close to the area I called.

Moving forward, there is much more technical resistance to push us down, rather than support to push us higher. Now that we’ve broken through the 200SMA, 100SMA, and are close to breaking the 50SMA, these figures are becoming resistance.

We are on the verge of breaking through the bear market line (20% draw down from recent highs) with the YTD low looking not too far behind it. We are approximately +12% away from the bull market line (20% gain over recent lows) and -7% from YTD low.

Signs are pointing lower. Key data releases next week of the Q3 GDP, jobless claims, PCE, and consumer sentiment will give us continued hints into the state of the economy and the lagging effects of rate hikes. The Fed is expecting lower GDP in the next year, maybe we see this begin with the Q3 GDP reading. This will be economic data release to watch next week in my opinion. Surprises in either direction could carry big moves in market prices.

With the next earnings season on the way, Fed commentary continuing to spark volatility, and mixed economic data, the next move is anybody’s guess. I think a near-term bounce is likely with more downside to follow after the new year. Then, January will be the month to watch as history shows that it sets the market’s mood for the rest of the year.

I would love to see more red next week so that I can buy more discounted stocks like I did this week. You can read about my buys in my weekly portfolio update here.

And if you like updates like this, follow my Twitter or my CommonStock page where I post updates on the economic data throughout the week.

Regards,

Dividend Dollars

Categories
Earnings Economics Market Recap Stock Market

Stock Market Week in Review (12/9/22) – This Week’s PMI and Next Week’s CPI

This weekly market recap is brought to you by Koyfin, a powerful analytical tool that I am proud to partner with. Their platform is entirely customizable for whatever data you want to look at including stocks, ETFs, mutual funds, currencies, economic data releases (one of my personal favorites used often for these posts), crypto, and even transcripts of company events! Click the link above to get a special offer only for Dividend Dollar readers or go give my product review a read if you’re interested!

Weekly Review

It was a trend-down week for the stock market after the quick run we experienced in the end of last week. At the start of the week, the S&P 500 was up over 10% for the quarter, the Dow Jones Industrial average was up over 18%, the NASDAQ composite was up over 6%, and the Russel 2000 was up over 11%

These gains have primarily been predicated on the notion that the Fed may soften its approach, a view that was presumably aided by Fed Chair Powell’s speech last week at the Brookings Institute.

This optimism was cooled this week as concerns resurfaced that the Fed might overtighten and trigger a period of much weaker growth or even recession. The main sticking point for the stock market is that a weaker growth outlook does not bode well for 2023 earnings.

A stronger-than-expected ISM Non-Manufacturing Index for November (56.5% vs 54.4% prior and a 53.3% expectation) also supported the idea that the Fed may rise rates higher and hold them there for longer.

Going into the historically strong “Santa Rally” month, this week was a disappointing start. The S&P 500 had the worst start to a month (five consecutive losses) since 2011.

Concerns that the Fed is going to trigger a deeper economic setback have been evident in the Treasury market for some time now. An inversion of the yield curve, which deepened this week, has often been a leading indicator of a recession. The 2s10s spread is now the widest it has been since the early 1980s. The 2-yr note yield rose to 4.37% and the 10-yr note yield rose to 3.63%.

Those growth concerns started to register more noticeably for the stock market this week. All 11 S&P 500 sectors lost ground, but the slimmest losses were registered by the counter-cyclical utilities, health care, and consumer staples sectors. The sharpest losses were logged by the energy, communication services, and consumer discretionary sectors.

Collapsing oil prices were another manifestation of the market’s growth concerns. WTI crude oil futures fell 10.8% this week to $71.29/bbl despite reports that China is easing up on zero-COVID related policies.

There was some economic data that reflected a welcome moderation in wage-based inflation. The revised Q3 Productivity Report showed a softer 2.4% increase in unit labor costs than the preliminary estimate of 3.5%. Stocks did not rally on the data, though.

The role of wage based inflation in the Fed’s policy decisions was highlighted this week by an article in The Wall Street Journal from Nick Timiraos, who some believe is the Fed’s preferred journalist for providing breaking information. Mr. Timiraos suggested that wage inflation could ultimately compel the Fed in 2023 to take its benchmark rate higher than the 5.00% the market currently expects.

In other news this week, the FTC is seeking to block Microsoft’s ($MSFT) acquisition of Activision Blizzard ($ATVI).

Looking ahead to next week, the market will be focused on the November Consumer Price Index (CPI) on Tuesday after the Producer Price Index (PPI) for November came in high this Friday. Then the FOMC decision and release of updated economic projections follows on Wednesday and could very well provide a volatile market for the week.

Dividend Dollars’ Opinion

That’s it for the recap. Now for my opinion!

Last week we had a clean rejection off of the major trendline on Monday, fell to the 100-day simple moving average on Tuesday, bounced a bit on Thursday, and fell back down to the 100 SMA on Friday.

This 100-day SMA has been triple-confirmed as support (small white arrows below) and will now be tested again this next week. Resistance at the 200-day SMA proved to work again this week. SPX ran into resistance at the 200-day SMA in August and couldn’t hold over it Monday morning.

Right now, the market is in a little bit of straddle under the 200SMA and the 100SMA. Break over the 200SMA and bulls could have a hayday until the meet the trendline again for the next task. Break under the 100SMA and bears could see a quick drop to 3,815 area as a gap fill.

Last week did not show much strength for buyers, so I think breaking down or hugging onto the 100SMA is a more likely path.

Economic events next week could bring huge momentum into the market in either direction depending on how they play out.

On Monday we have the treasury budget which shouldn’t be too significant. If anything, Monday price action will be fairly uneventful as the market awaits the CPI reading on Tuesday. If the CPI comes in higher than expected, the market could drop fast. If CPI comes in better than expected, investors will still wait for the FOMC rate decision on Wednesday to truly bring in heavy buying power.

Wednesday will be the key to next week. As we get closer to the Fed Funds target rate with each rate hike, the subsequent rate hikes become more and more important as clues to tell us if the Fed over or undershot. The market expects a 50-bps hike on Wednesday, if we see higher or low expect volatility.

Then, Thursday will bring us retail data which will give input on the state of the consumer. All of these big items together will make next week one to remember (and be cautious of).

Add to that, next week is also the last week of earnings season with a couple of big tech names ($ADBE and $ORCL) reporting. Q3 earnings, from the 497 S&P 500 companies that have reported so far, have a 59% beat of the top line and 69% beat of the bottom line. This was 63% and 76% last quarter, respectively.

Big misses by the earnings next week could enhance any downward moves that are predicated by the economic events. Any surprises won’t carry much weight into what appears to be a very bearish week next week.

What’s more important is drop in earnings beats from last quarter. This is a clear sign that the Fed driven growth slow down is occurring. Expect more lack luster earnings seasons, and to greater degrees, while we stay in this high-rate environment.

Overall, next week’s performance lies greatly with the CPI and Fed rate change. Those things are tough to predict, therefore, outside of those events and looking only at technicals, I think next week is a red one. But only time will tell! Be ready either way!

I was ready for the move down last week and made some favorable adds to my portfolio. You can read about these moves in my weekly portfolio update here.

And if you like updates like this, follow my Twitter or my CommonStock page where I post updates on the economic data throughout the week.

Regards,

Dividend Dollars