Welcome back to the weekly Dividend Dollars portfolio review! This post is brought to you by Koyfin, a powerful analytical tool that I am proud to partner with. Their platform is entirely customizable for whatever investment data you want to look at. I wouldn’t use any other website to dive into a stock’s fundaments. Click the link above or picture below to get a special offer only for Dividend Dollar readers or go give my product review a read if you’re interested!

Here at Dividend Dollars, our investing approach is a dividend growth strategy with aspects of value investing and fundamental analysis. I am a young investor in my 20’s and by sticking to this strategy over the long term, the magical powers of compounding are on my side. This allows me to more easily build substantial positions in dividend paying stocks over time, which will one day help me reach the ultimate goal of being financially free through the sources of passive income they provide. You can read more about the strategy here. Let’s dive into the portfolio review!
Portfolio Value
To date, I have invested $18,615 into the account the total value of all positions plus any cash on hand is $18,442.15. That’s a total loss of -1.04%. The account is down $392.31 this week which is a -2.09% loss. We added $145 in cash to the account this week, trades made will be broken out below.

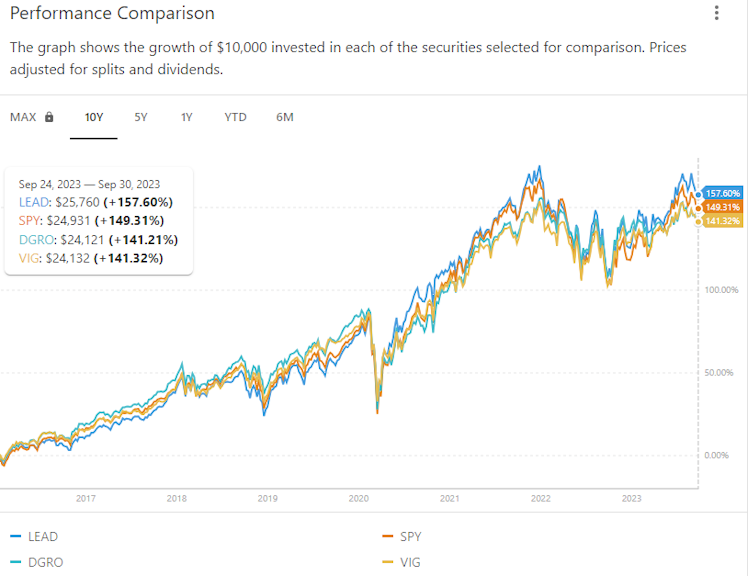
We started building this portfolio on 9/24/2021 and when compared to the S&P 500 we are outperforming the market so far! Within that same timeframe, the S&P 500 is down -3.30% which puts us 2.26% higher than the market!
Portfolio

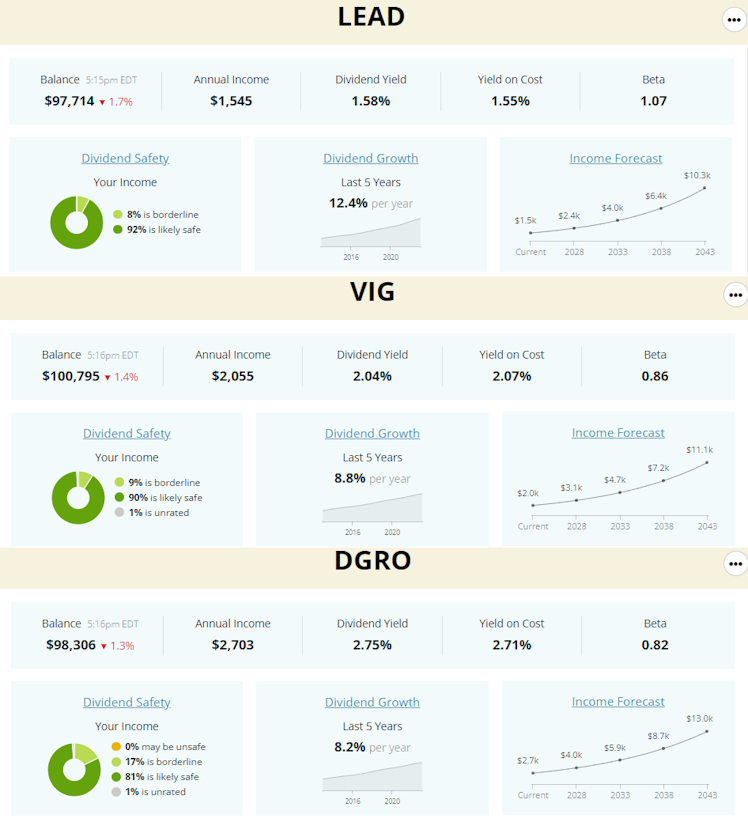
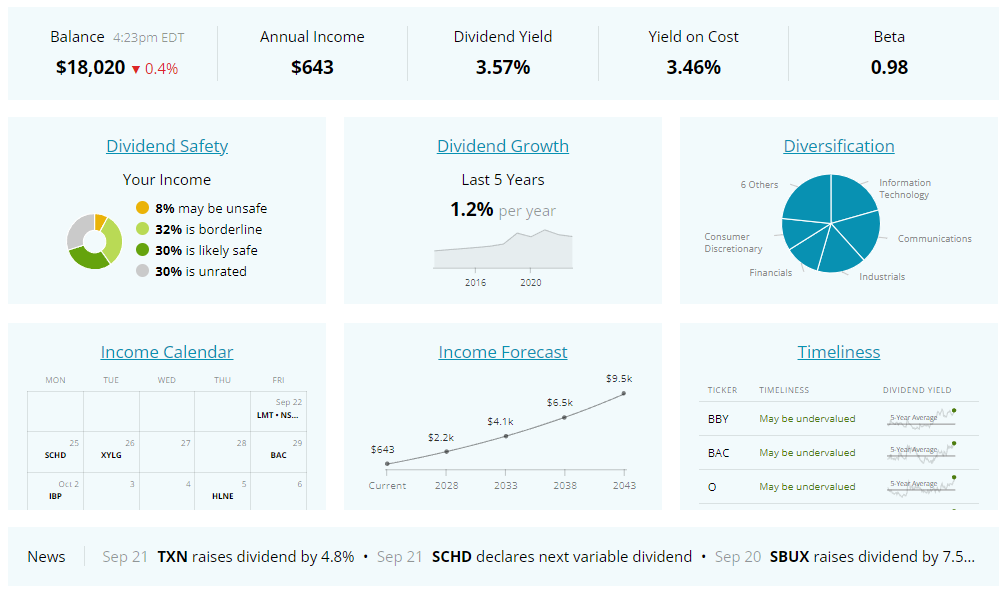
Above is a dashboard of the portfolio that tracks annual dividend income, yield, beta, dividend growth, and more.
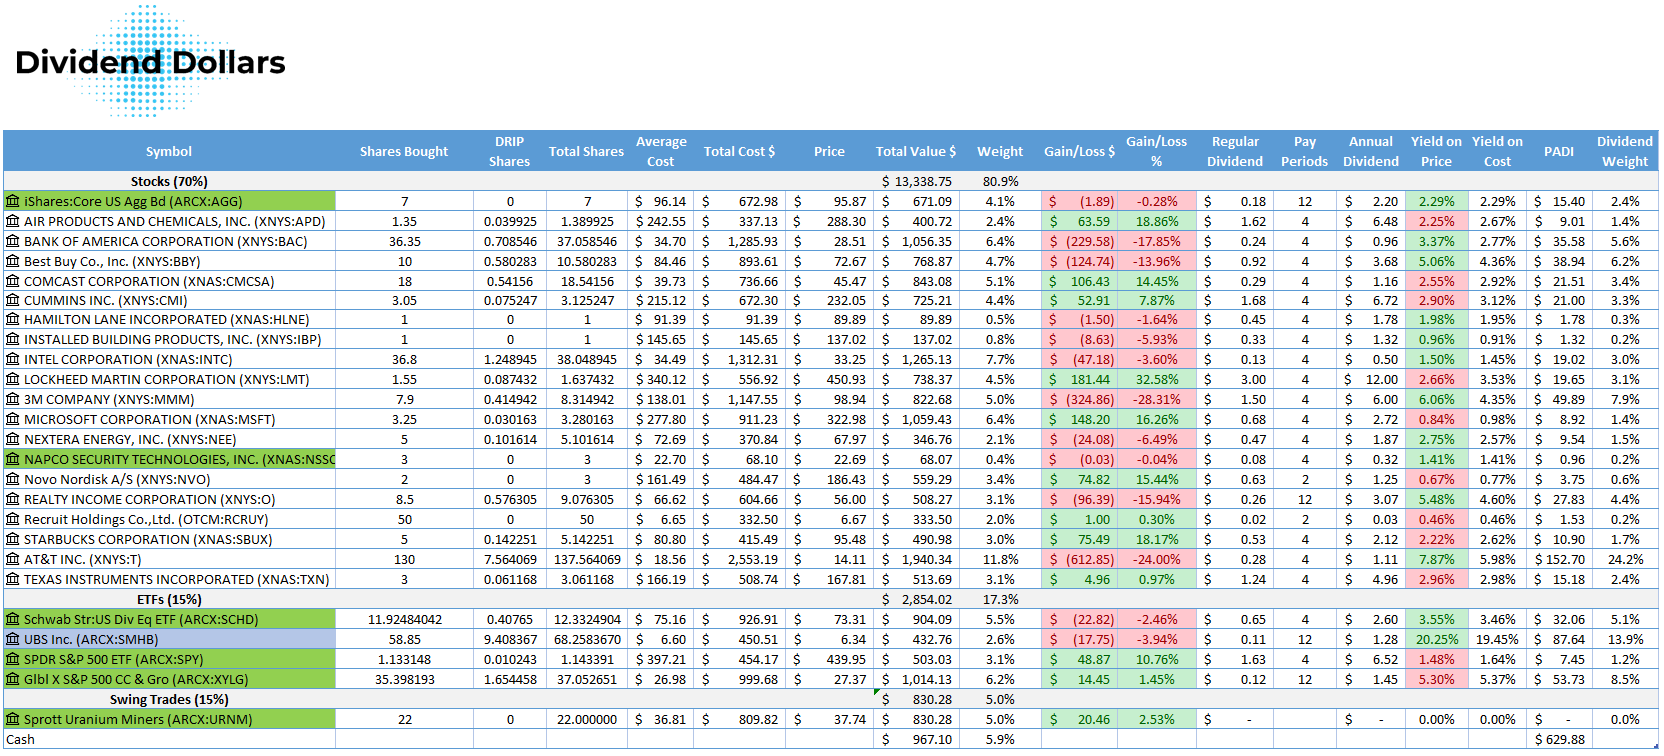
Below is a table of everything we are invested in so far. There you can see my number of shares, shares bought through dividend reinvestments, average cost, gains, and more. The tickers in green are positions that I bought shares in this week, the blue ones are positions that I reinvested dividends into, the yellow ones are positions that announced a dividend increase this week, and the red are positions that I trimmed. Our PADI increased from $641 to $663!

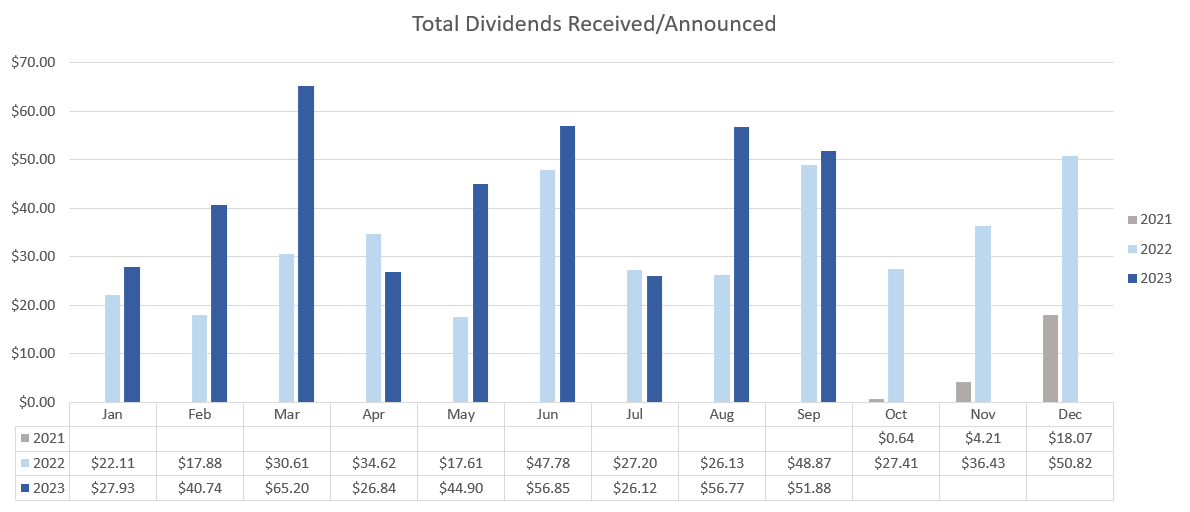
Dividends
Over the last week I received two dividends: $0.66 from $IBP and $0.89 from $HLNE
Dividends received for 2023: $411.41
Portfolio’s Lifetime Dividends: $821.81

Trades
This week was a tough week for the markets. We didn’t make a ton of moves, but the moves that we made were big ones.
First, we made a large ~13 share purchase on $BAC. Bank of America has had a brutal week and month losing 5.6% and 8.3%, respectively. Morgan Stanley reduced their price target for the bank by two dollars to $32. Banks and high yielding dividend stocks have come under pressure as Treasury yields continue to climb. As the risk-free rate goes higher, the premium needed to make the value proposition of holding these stocks becomes harder for investors to stomach. $BAC earnings comes up on 10/17 and $0.80 EPS and $25.13B revenue are expected. Recent moves in the stock price shows that the market thinks this is a lofty expectation. A recession still potentially looms over the economy and eventual rate cuts could hurt the banking sector’s performance. However, history shows us that that impact only lasts for the short term. If that happens, it could be a good buying opportunity. However, I think the more likely case is that the economy actually avoids a recession and the fear in the market and industry right now provides a good buying opportunity. Therefore, I increased my position substantially this week.
Then, our 10-day trailing stop on $URNM was hit at $43.21. I’m a little frustrated because the stock bounced back up after that red day. It closed the week at $45.31 and with the exception that last red day, this sucker could still run for who knows how long! But we still won with a 15% gain. Oh well, we will keep our eyes peeled for the next turtle play. If you want to learn more about the turtle trend strategy, I have published a full article on it which you can read here. The below table is a log of the trades taken under the strategy so far.

Then, we sold $15 10/6 covered call on $T for a $1 premium. It’s hardly anything to celebrate, but I figured I should start being more proactive with squeezing out whatever bonus income I can get out of that position. The call expired worthless on Friday, giving me a 100% on that $1.
Then, similar to the thinking with the $BAC add, we did an add to $O. But this was a much smaller add. We also added to $SMHB as small caps are nearing a support level and yields are getting attractive, this dip in the sector looks like a gift.
Lastly, reinvested our $HLNE and $IBP dividends. Below is a breakdown of the trades I made this week:
- October 2nd, 2023
- Installed Building Products ($IBP) – dividend reinvested.
- October 3rd, 2023
- Bank of America ($BAC) – added 13.65 shares at $26.12.
- October 4th, 2023
- Sprott Uranium Miners ETF ($URNM) – sold position at $43.16, stop hit for a 15% win.
- October 5th, 2023
- AT&T ($T) – sold 10/6 $15 covered call for $1, expired worthless.
- October 6th, 2023
- Hamilton Lane ($HLNE) – dividend reinvested.
- Realty Income ($O) – 1.3 shares added at $49.69.
- ETRACS 2xMonthly Levered Small Cap ($SMHB) – added 20 shares at $5.49.
Summary
That is it for the update this week. Let me know what you think of the progress so far, share with me your progress and questions, interact with me on Twitter and CommonStock as well as the other socials using the links below! Also, tune into the Games N Gains Twitch Stream every Thursday at 6PM MST. I play games, hang out, and chat with y’all about stocks, charts, fundamentals, and anything else you like! I hope to see you in there!
Thank you for reading! See you next week and stay safe!
Regards,
Dividend Dollars
This post is brought to you by Sharesight, a portfolio tracking tool that I am happy to partner with. Their platform makes tracking trading and dividend history, understanding your performance, and saving time a breeze. I wrote a review of the product that you can read here if you’re interested in learning more! Click the link above or the picture below to get a special offer only for Dividend Dollar readers!