This weekly market recap is brought to you by Koyfin, a powerful analytical tool that I am proud to partner with. Their platform is entirely customizable for whatever data you want to look at including stocks, ETFs, mutual funds, currencies, economic data releases (one of my personal favorites used often for these posts), crypto, and even transcripts of company events! Click the link above to get a special offer only for Dividend Dollar readers or go give my product review a read if you’re interested!

Dividend Dollars’ Outlook & Opinion
Last week we called for a neutral to moderately bullish week in the market, and we got exactly that. The market moved slightly higher Monday, dropped hard Tuesday and Wednesday, before climbing back up the valley with strength on Thursday and Friday to end the week slightly in the green.
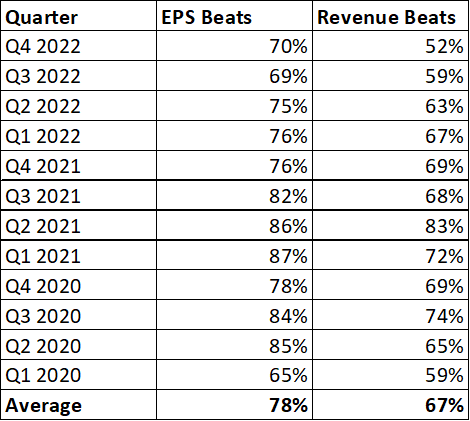
With the end of this week, earnings season is essentially over with 97% of companies having reported. 78% of companies reported positive EPS surprises with 76% reporting positive revenues surprises. The biggest surprise of all came from the $NVDA AI fueled earnings report. AI seems to have become a hot topic of conversation for this earnings season as a record number of companies mentioned the term in their earnings calls.

Aside from earnings, it was a fairly mild week for economic data. Core PCE came in very close to the estimates showing that inflation is still well above targets and jobless claims were lower showing that labor is still hot.
Technicals-wise, we finally got a little bit of a pull back this week on concerns of the debt ceiling. But then the unprecedented earnings report from $NVDA on Thursday singlehandedly turned things around. SPX, for another week, remains solidly above the 200, 100, and 50-day moving averages and is testing the 4,200 level for the 4th time in just two weeks. At the end of this week, a drop to the bear market low would take a 15% move, while the level needed to declare a new bull market is only 2% higher.

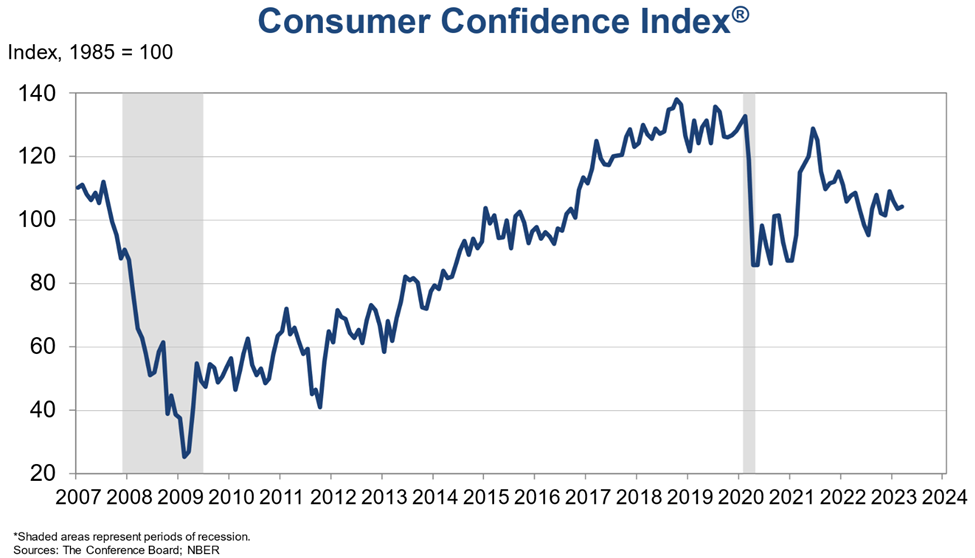
Even though next week is shorter with the holiday weekend, it still brings a good number of data releases. Next week is heavy with labor data releases, plus a consumer confidence reading, and ISM/PMI data. The current employment situation and inflation levels have raised the odds of another interest rate hike and I would be surprised to see if the coming data shifts that much.
As for sentiment indicators, there were a few more upgrades than downgrades. With VIX and ETF open interest changes, VIX and SPX open interest put/call ratio changes, and VIX implied volatility gap moving into more bullish territories while VIX and equity open interest and put call/ratio changes moved downward into neutral territories.
However, much like last week, since the debt ceiling issue is not resolved, this week’s outlook has a dual perspective again. With a no deal debt ceiling and the June FOMC meeting approaching, volatility is expected. On the other hand, if a ceiling deal is reached over the weekend even without being signed into law, a relief rally could result in a moderately bullish week ahead.
Weekly Market Review
Summary:
Much like how I finished this week on an upbeat note leading into the holiday weekend, the market did the same! Major indices saw some volatility as we dealt with a lot conflicting sentiments. Regardless, the SPX closed above 4,200 at its highest level since last August. Uncertainty about the debt ceiling and Fitch’s concerns about the US’s credit rating kept price action in check in the early week. However, by Friday, angst was eased as information on ceiling negotiations were released and $NVDA earnings charged the tech space.
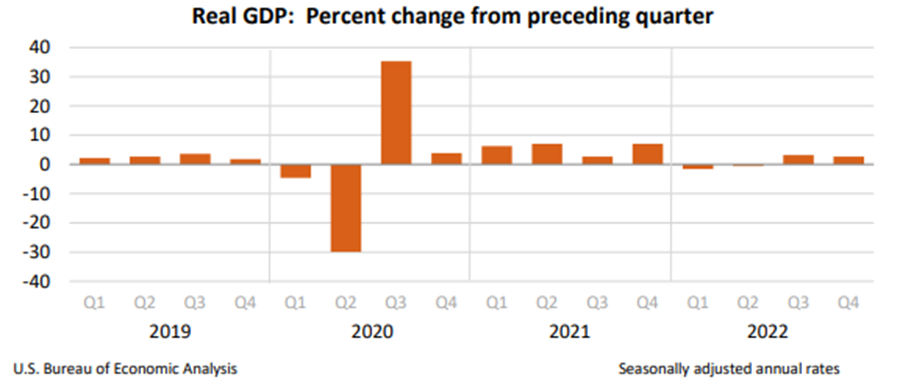
Economic data this week corroborated some Fed members’ concerns that more rate hikes may be needed. Kashkari, Bullard, Waller, and Mester all were cited speaking this week that a pause isn’t guaranteed at this point. The higher-than-expected Q1 GDP report, lower than expected jobless claims, strong consumer spending, and uptick in PCE year-over-year all added to the case that more cooling may be needed.
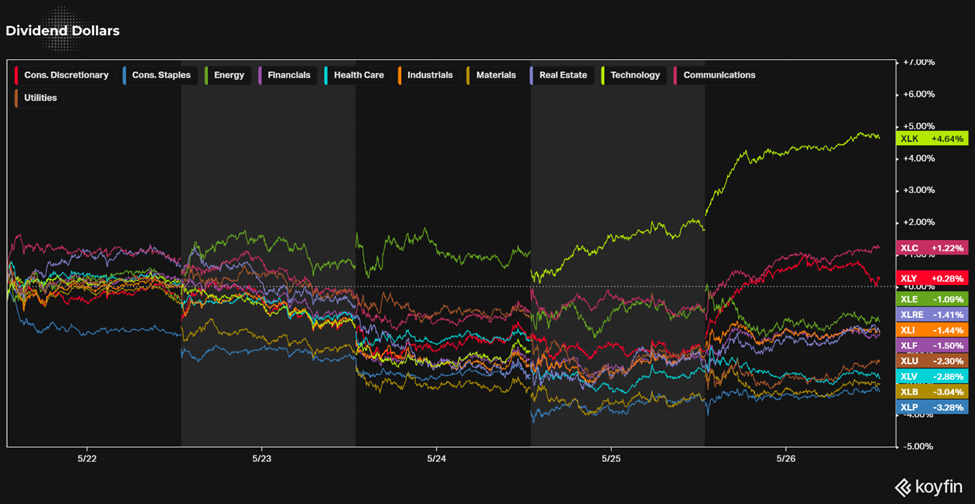
Mega caps continued their outperformance with $MGK rising 2.2% this week versus a 0.3% gain in the market-cap weighted S&P 500. Meanwhile, the equal weight S&P 500 ETF $RSP fell 1.2%. The technology sector was the standout winner for the week while 8 of the 11 sectors all marked losses over 1% for the week.
Monday:
Monday had mixed action, but ultimately ended the day a little higher than the open, but not with much conviction as debt ceiling concerns were growing over the weekend. Janet Yellen reiterated that early June is the hard deadline for the ceiling and that the odds of the government paying its bills on the 15th are quite low.
Add to that commentary, the commentary from Fed President Kashkari that a decision to pause rate hikes in June is a close call and that a pause would not signify that tightening is over. Fed President Bullard also said that he thinks two more hikes are needed this year.
Stocks didn’t have huge reactions to these catalysts. The market clung to narrow ranges for most of the day while briefly peaking over the 4,200 level a few times. Price action could not hold above it, even with mega caps and bank stocks having a strong showing. The latter was spurred on by news that $PACW had entered into an agreement with $KW to sell a portfolio of real estate construction loans with a balance of $2.6B outstanding.
Tuesday:
Tuesday was another mixed day with no strength on either side of the tape. Mega caps dragged on the market, even though broader equities were holding up okay. Things began deteriorating as more press reports came out that a debt ceiling deal was far from agreed upon. House Speaker McCarthy said that a deal was nowhere near while House Minority Leader Jeffries said there is not a lot of progress being made.
The energy sector was the lone positive closer for the day, as $CVX offered a boost on its stock upgrade from HSBC. Consumer discretionary was down -0.9% as the outperformer, partially supported by $LOW’s earnings report.
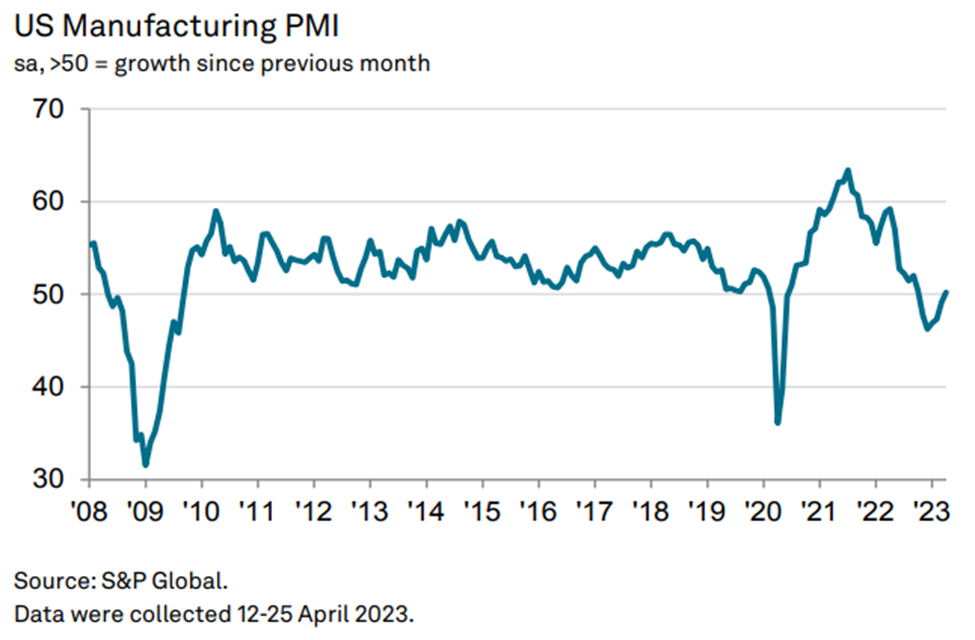
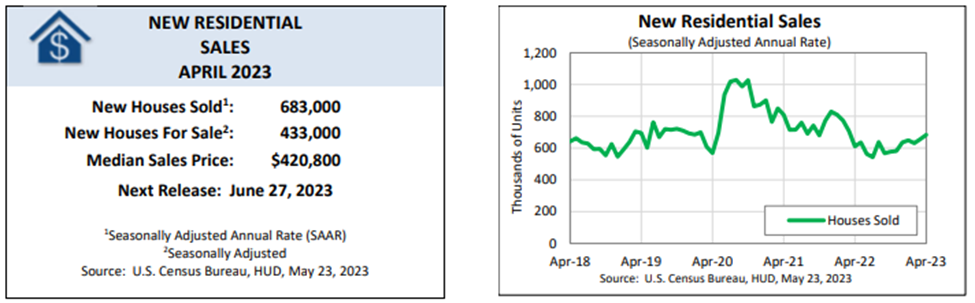
Tuesday’s economic data included the IHS Market Manufacturing PMI and the New Home Sales Report. The latter event was up 4.1% MoM in April to an annual rate of 683k units, above the expected 660k and the 656k prior reading. Year-over-year sales were up almost 12%. Higher mortgage rates are holding down new homes sales activity as seen by the sales decline in the higher-priced Northeast and West regions that reflected affordability pressures.
The Manufacturing PMI fell to 48.5 in the preliminary May reading from 50.2 and back into contractionary territory. The Services PMI rose to 55.1 up from the 53.6 May reading, the highest level in 13 months. The Composite PMI was 54.5, also its highest level in 13 months. Overall, growth output seen in May was the fastest in over a year.

Wednesday:
Another weak showing happened this day, lead on by an approaching X-date for the ceiling battles. Reports of an impasse were somewhat corroborated by House Speaker McCarthy who told reporters that negotiations are still far apart on issues, but talks would continue.
The market also had to digest lingering rate hike concerns after Fed Governor Waller said that we need to maintain flexibility on the best decision to take in June… fighting inflation continues to be my priority. These concerns took a back seat to the debt ceiling angst though. The major indices all closed with losses, regardless of the attempted rebound in the late afternoon.
The weekly MBA Mortgage application Index came in Wednesday at 4.6% with a 4% drop in purchase applications and a 5% drop in refinance applications. With the average rate of a 30-year mortgage reaching its highest level since March, borrowers continue to be deterred.
Thursday:
Thursday was a mixed showing on the back of many news catalysts. The biggest one was $NVDA’s huge gain after reporting strong Q1 results with very optimistic Q2 guidance. $NVDA’s results fueled buyers in other semi’s and mega-cap stocks that propped up the broader market. Still though, market breadth reflected underlying weakness as Fitch watchlisted the US’s credit rating and Congress members reported their day off on Monday in spite of much needed continued negotiations. However, progress did seem to be made on negotiations and news said differences are narrowing.
Pleasant economic data with the Q1 GDP, jobless claims, and pending home sales came in.
US GDP growth during the Q1 period was revised higher to 1.3%, up from 1.1% in the initial estimate. The change was mainly a result of an upward revision to private inventory investment. Consumer spending was revised slightly higher to 3.8%, a good sign in spite of the ongoing inflation pressures.

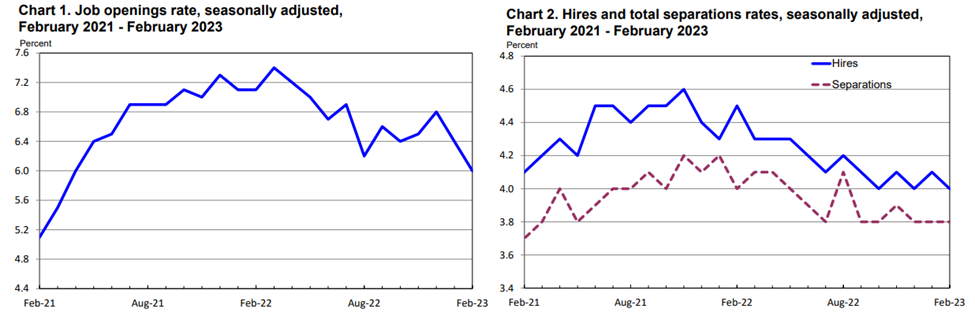
Initial jobless claims rose less than expected to 229,000, vs estimates of 245,000. Claims were at 225,000 last week. Continuing claims were slightly lower at 1.79 million. Claims continue to be nowhere near recession levels and continue to reflect a hot labor market.

Pending home sales were flat in April, missing expectations of 1.0% growth. Pending home sales are down 20.3% YoY. Sales were up 3.6% in the Midwest and 4.7% in the West.

Friday:
Friday saw the market end the week on an upbeat note. Ceiling concerns seemed to ease somewhat as an solution was anticipated to be near. Mega-caps continued to boost the indices with economic data pointing to a resilient economy. Semiconductor stocks also continued to rally, with $SOX hitting a 6% gain after $MRVL reported good earnings and guidance.
The rally for the day was not weakened by rising concerns of another rate hike at the June meeting. According to the CME FedWatch Tool, there is a 64.2% chance of a 25 point hike, up from 51.7% yesterday and 13.7% a month ago. This followed the economic data releases for the day which showed strength and quelled worries of a hard landing. This data included the personal income and spending report, durable goods orders, trade in goods report, and consumer sentiment.

Personal income was up 0.4% MoM in line with expectations and above the 0.3% seen prior. Personal spending was up 0.8% MoM above the expected 0.4% and the 0.1% seen prior. The PCE Price index was up 0.4% MoM above the expected 0.3%. This was up 4.4% YoY versus the 4.2% seen last month. The Core PCE Price index was up 0.4% MoM above the expected 0.3% and was up 4.7% YoY versus the 4.6% seen last month. The 0.5% increase in real spending and the uptick in the YoY rates are the key takeaways here. This combination gives the Fed a reason to second guess if a pause is the right move now.
Durable goods orders rose 1.1% MoM in April versus an expected -1%. Excluding transportation, orders fell 0.2% MoM, lower than the expected -0.1%. The key in this report was that non-defense capital goods orders (a proxy for business spending) were up 1.4% MoM, a good sign.

The advanced international trade in goods report for April showed a growing deficit to $98.6B from an upwardly revised $82.7B deficit in March. This gap grew substantially as exports were $9.5B less than in March and imports were $4.5M more. Retail inventories jumped 0.2% while wholesale inventories fell by the same amount.

Finally, the University of Michigan Consumer Sentiment index hit 59.2 in May versus an expected 57.8. This is also higher than the preliminary reading of 57.7 but down from the April reading of 63.5. This time last year, the reading was slightly lower at 58.4. Consumer sentiment improved from mid-month, yet worsened from April as worries about economic outlook increased.
That’s it for my recap! If you would like to see how I am building my dividend portfolio using my predictions/strategy written here, you can read about my buys in my weekly portfolio update on this link.
And if you like updates like this, follow my Twitter or my CommonStock page where I post updates on the economic data throughout the week.
Regards,
Dividend Dollars