


This weekly market recap is brought to you by Koyfin, a powerful analytical tool that I am proud to partner with. Their platform is entirely customizable for whatever data you want to look at including stocks, ETFs, mutual funds, currencies, economic data releases (one of my personal favorites used often for these posts), crypto, and even transcripts of company events! Click the link above to get a special offer only for Dividend Dollar readers or go give my product review a read if you’re interested!


Dividend Dollars’ Outlook & Opinion
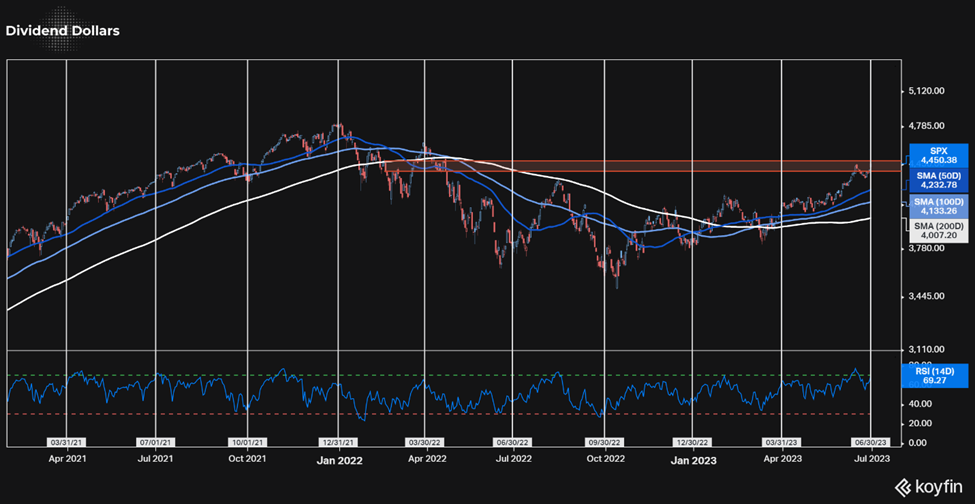
Last week we gave a mixed outlook for this week, saying the direction would be dependent on the big data releases. Most all data beat expectations this week and we saw the S&P 500 climb to 4,450, right next to the high I had called out if things moved in positive direction. It’s hard to feel positive about a 50/50 guess, but the target was spot on!
Like last week, there were hardly any downside surprises in the data. Core PCE came in below estimate, mostly due to lower energy prices. Initial Jobless Claims fell surprisingly low. Strong economic data seemed to help support the equity rally that began in late-May.
In the 22 versions of this that I’ve written for 3x, and almost 1 years’ worth of weekly updates for my own website, I haven’t missed too often. But my understanding of the data and forward looking guesses are not always right. Despite some indicators having negative moves last week and despite being technically overbought via the RSI we talked about a few weeks ago, the S&P 500 had another >1% gain this week.
As we wrap up this quarter with a YTD gain of over 15% on the S&P 500, its time to look at what may come. Historically, when the first half of the year ends with a gain of 10% or more, there is an 80% chance that the market ends the year higher than that level, good news for us. However, bad news is that major funds track performance on a quarterly basis which creates a tendency for markets to pivot in the opposite direction on the first day of the calendar quarter (white lines). Additionally, we can see that when the RSI extends over 70 pullbacks occur. We are at a point in time where both are happening. There is a lot working in the market’s favor next week, but this is something to be aware of.

With a new quarter starting, there are plenty of signs pointing to caution. However, continued improvement in economic data and strong bullish momentum says otherwise. A number of sentiment indicators turned bearish this week like the VIX, SPX, ETP and OI change, and the VIX OI put call ratio. However, in general, put call ratios for equities turned more bullish this week, as well as the VIX IV gap. Improvements and downgrades in these indicators are fairly equal to either side. The next interest rate hike (if we get one) is still four weeks away, the next earnings season start is 3 weeks away, and technicals wise, there is room to upside without too much undue resistance. I don’t expect a sideways market next week. I personally am leaning bullish and would like to see a push higher to the 4,480-4,500 range, however if we find ourselves in a red week 4,380 and then 4,300 would be my targets.
Weekly Market Review
Summary:
This was winning week all around with not a single loss from any of the 11 S&P 500 sectors. Growth and value spaces also moving higher. More importantly, $RSP was up 3.4% this week which was 1.4% higher than $MGK showing wide buying interest.
This week was a rollercoaster of a news week with the reported Russian coup over the weekend, encouraging economic data, central bank speak reinforcing the idea of continued tightening, a number of IPOs, the Fed’s bank stress test results, and a handful of earnings.
The feeling in the market seemed to be one of a belief that the US can avoid a recession and the Fed is nearly done raising rates. This idea generated buying interest in the market. Sectors that were relative laggards this week were the countercyclical staples, utilities, healthcare, and utilities sector. Communications was the least strong of them all, but the downgrade on $GOOG from UBS was primarily to blame for that. Real estate, energy, materials, and financials were the largest winners for the week.

Monday:
Monday was a quite day with no economic data releases of import or shocking price action. The market was in slight downtrend for most of the day, ending down nearly 0.40%.
Tuesday:
The market slightly higher this day and truly fell into a bullish stride as economic data was released. Markets had bounced back from a losing day on Monday with the Dow Jones finishing lower for the 6th straight day, the longest losing streak since September.
For economic data, the S&P CoreLogic Case-Shiller U.S. National Home Price Index (HPI) increased 0.5% in April, though prices were down 0.2% YoY, the first annual decline since April 2012. The closely watched 20-city HPI rose 0.9% for the month, but prices were down 1.7% YoY, which was better than expected. Elsewhere, the FHFA HPI was up 0.7% in April and 3.1% over the past year.


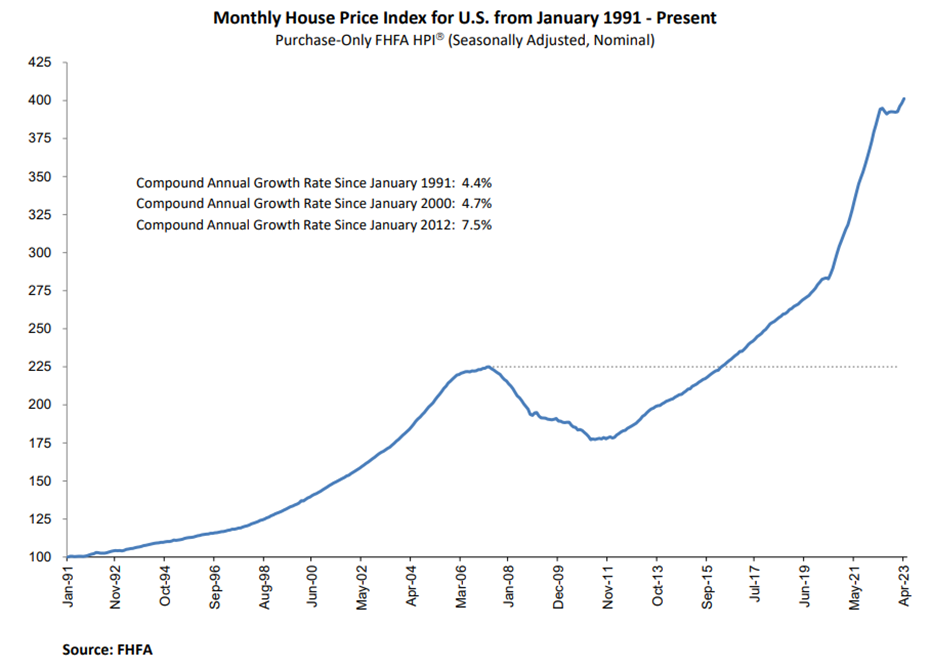
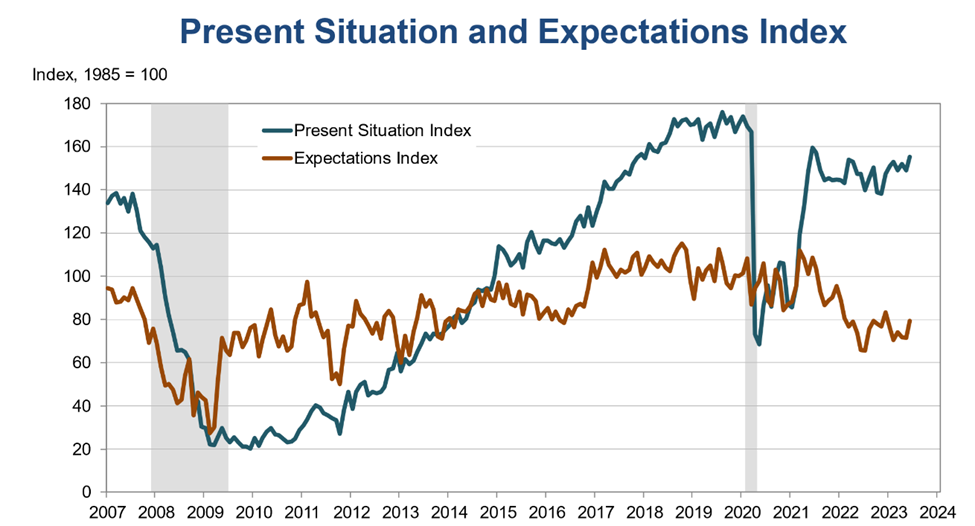
New home sales jumped 12.2% in May to an annual rate of 763,000, easily beating expectations of 675,000 & the highest level since Feb 2022. The median sales price was $416,300. Lastly, the Consumer Confidence Index rose more than expected to 109.7 in June, the highest level since Jan 2022. The report had been expected to come in at 104.0. Both the present situation and expectations index were higher.


Wednesday:
Stocks opened lower for the day as investors tuned into Fed Powell’s conference with 3 other central banks in the morning. Their comments had not had lasting effect as the market pushed for daily highs in the midday before normalizing for a slightly green close on the day.
Bank stocks rose following the annual Fed stress test that was released yesterday. The 23 biggest US banks all passed the test despite massive losses projected for the group. Fed Chair Jerome Powell signaled more restrictive policy is on the way, with the possibility of rate hikes at consecutive meetings.
MBA mortgage applications rose 0.5% last week. Purchase applications were up 2%, while refinance applications were down 2%. The report also showed that the average interest rate of a conforming 30-year mortgage fell four basis points to 6.73%, the 3rd consecutive weekly decrease.
Thursday:
The market looked much like Wednesday in that it steadily moved up, but with less prominent peaks and valleys.
For economic data, initial jobless claims unexpectedly fell to 239,000, compared to an expected increase265,000. Continuing claims were marginally lower at 1.74 million.


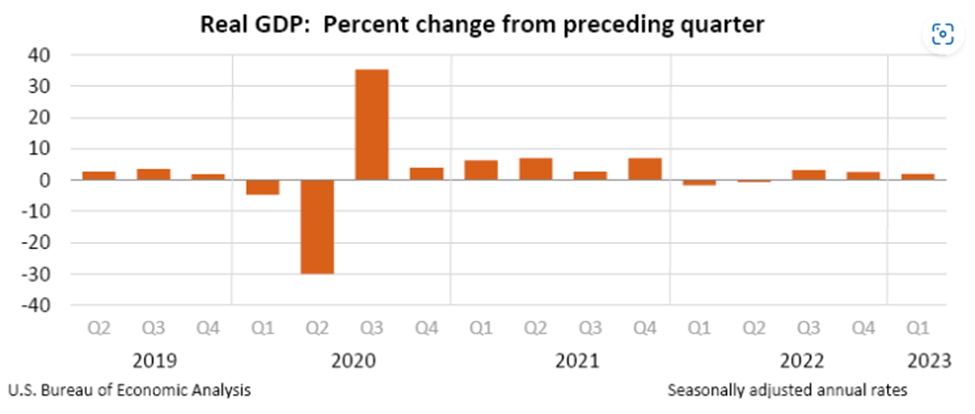
The third estimate of first quarter U.S. GDP was revised higher to 2.0%, up from 1.3% in the previous estimate. Consumer spending and exports were revised higher, while imports moved lower.

Friday:
Stocks opened dramatically higher for the way and were ready to cap off this quarter with a bang!
Year to date, the S&P 500 has increased 15.5%, its best first half since 2019, and the Nasdaq has increased 31%, its best first half since 1983. However, the Dow has increased by just 3.6% over the same time period.
In economic news, the fight against inflation appears to be working. The personal consumption expenditures price index increased 0.1% in May and 3.8% year over year. Stripping out food and energy, core PCE increased 0.3% for the month and 4.6% year over year. Spending slowed significantly from April to May going from 0.6% to 0.1%, respectively. Income increased to 0.4% in May, from 0.3% in April.

That’s it for my recap! If you would like to see how I am building my dividend portfolio using my predictions/strategy written here, you can read about my buys in my weekly portfolio update on this link.
And if you like updates like this, follow my Twitter or my CommonStock page where I post updates on the economic data throughout the week. I have also started a Twitch Channel called Games N Gains! Every Thursday at 6PM MST I go live to hang out, play games, and chat with y’all about stocks, charts, fundamentals, and anything else you like! I hope to see you in there!
Regards,
Dividend Dollars