


This weekly market recap is brought to you by Koyfin, a powerful analytical tool that I am proud to partner with. Their platform is entirely customizable for whatever data you want to look at including stocks, ETFs, mutual funds, currencies, economic data releases (one of my personal favorites used often for these posts), crypto, and even transcripts of company events! Click the link above to get a special offer only for Dividend Dollar readers or go give my product review a read if you’re interested!

Dividend Dollars’ Outlook & Opinion
Last week’s call of moderately bullish to neutral was a huge miss with the S&P 500 being down -1.60% for the week. However, we have said for two weeks in a row now that we would not be surprised to see a pullback.
Earnings season is winding down with approximately 84% of companies in the S&P 500 having reported so far. So far, they have beaten expectations on an EPS basis 80% of the time and on a revenue basis only 58% of the time.
On the economics front, this was a busy week for data. Employment figures continue to beat expectations while PMI, ISM, and construction figures are all worse than expected.
From a technical perspective, the key area of resistance that we have been watching (red channel) resulted in a strong rejection this week. Price action went under the 0.786 fib level and stayed under it for all of Thursday. Friday tested the level, but failed to get above it and ended the day in deep red. With the next fib level of 0.618 being nearly 4% away at $4,310, I’m looking closer for support. The white line at $4,450 will be my key level before determining if $4,310 is next.
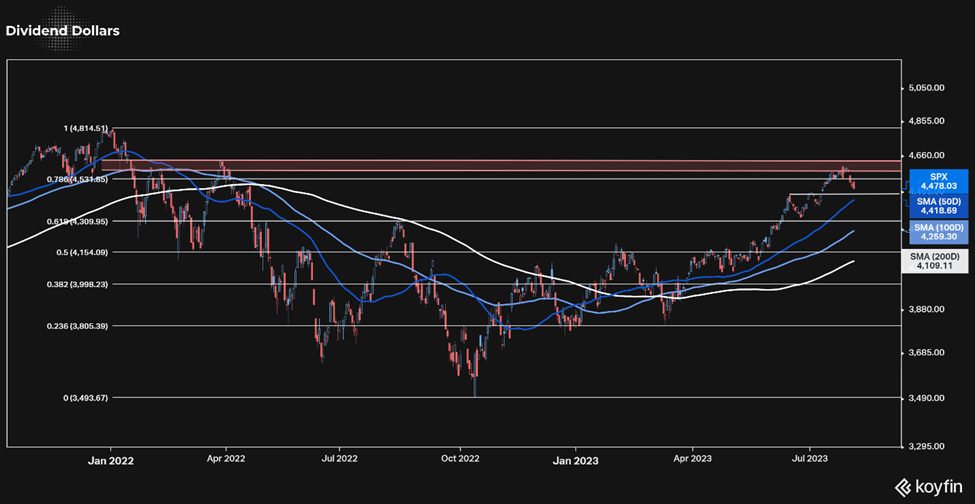
The other chart that we have been eyeing has progressed interestingly this week. All the red this week has us closing perfectly on the bottom level of the ascending channel that the market has been in since the debt ceiling was resolved. I’ll be very interested to see if we get the continuation bounce next week that this channel is indicating.

Sentiment indicators adjustments were a little mixed this week, if not slightly bearish. VIX open interest change, VIX OI put call ratios, CBOE Equity volume put call ratios, and VIX levels all worsened. However, only VIX OI appears bearish, the rest all moved down to more neutral territories. Meanwhile, SPX OI change improved to moderately bullish, while CBOE VIX VCPR moved to neutral and OCC Equity VPCRs moved to volatile.
Overall, rising treasury rates throughout the week, with the exception of Friday, kept downward pressure on the markets. Volatility was enhanced by the US credit downgrade by Fitch on Tuesday and the technical resistance on equities. Tuesday was the largest daily decline on SPX since late April, while VIX jumped to a 3-week high. Market’s calmed down by week end as economic data came in, however, there’s more to come next week with a CPI reading on Thursday and PPI reading on Friday.
Given this, next week’s performance will largely be determined by the reception of those reports. Regardless of the reports, sentiment indicators report neutral on price action for next week, while nearby technical support levels could provide some upside. Given the overall mixed bag here, I am leaning neutral for next week.
Weekly Market Review
Monday: The market was mostly flat on the index levels, before eking out slim gains to end the day and the month. Many stocks took part in the late afternoon rise as the $RSP equal weight ETF was up +0.3% compared to the +0.1% $MGK growth ETF.
The timid action in the early hours seemed mostly to anticipation for the busy week of earnings and data in later in the week. Despite the hesitancy, market breadth was positive as winners beat losers by 5-to-2 at the NYSE and 5-to-3 at the Nasdaq.
Data for Monday included only the Chicago PMI report, which came in at 42.8. This is a beat on the prior reading of 41.5, but fell short compared to the expected 43.0.

Tuesday: The market experienced some selling pressure to begin August, though the downside moves were relatively modest. Selling interest was pushed by rising market rates and the feeling that a consolidation was overdue. With Tuesday’s losses, $SPX was still up 19.2% for the year. The 10-year treasury yield closed above 4.00%.
The Dow outperformed with +0.2% on the back of a big move higher from $CAT’s well received earnings report. Other notable earnings resulted in large sell offs for $NCLH, $UBER, and $ZI.
Economic data for the day included the S&P Global US Manufacturing PMI, the ISM Manufacturing Index, the total construction spending report, and the JOLTs job report.
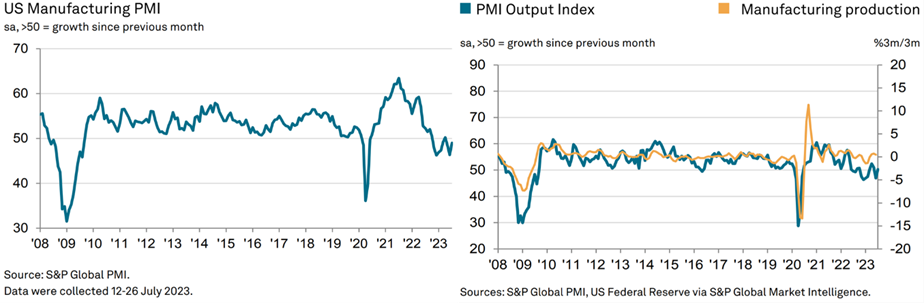
The US Manufacturing PMI rose to 49 in the July reading, up from 46.3 in June. Their chief business economist mentioned that producers are clearly shrugging off recession fears, but manufacturing continues to be a drag on the US economy. Lower demand and the shift in spending from goods to services has led to a drop in orders, however, the rate of decline in the order book is moderating.
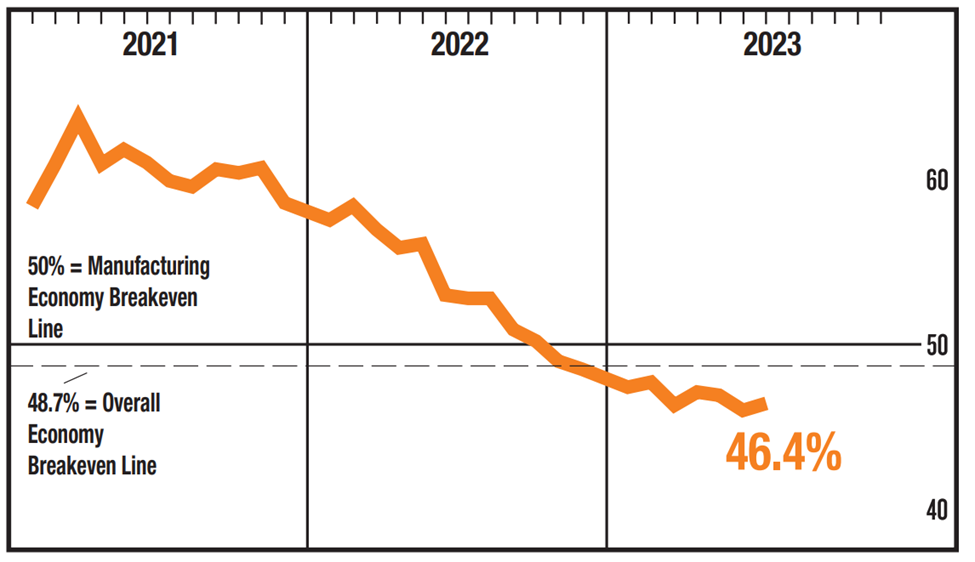
The ISM Manufacturing Index rose to 46.4% in July, up from 46% in June but below the expected 46.8%. The line between contraction and expansion is 50%, making this reading the 9th straight month in contractionary area. The takeaway from the report is that there are more signs of employment reductions in the near term to better match the state of production. This is in line with the Fed’s thinking that rate hikes will lead to some softening of labor.
Total construction spending rose +0.5% MoM in June, compared to a +1.0% move in May and an expected +0.6% reading for this month. Total private construction was up +0.5% MoM and total public construction rose +0.3% MoM and +3.5% YoY. Residential spending continues to be powered by new single-family construction to meet the demand that the existing home market leaves unanswered for.

JOLTs job openings were at 9.58M in June, below the 9.61M estimate & down from 9.82M last month. Both the number of hires and separations decreased during the month.

Wednesday: Wednesday gave us a solid sell-off with mega caps and growth stocks pacing broad losses. Jump in yields on Wednesday gave investors an extra excuse to take risk off.
In the overnight, market rates had been moving lower despite the news that Fitch Ratings downgraded the US’s credit rating to AA+, down from AAA. The downgrade reflects an expected fiscal deterioration over the next few years, growing government debt, and erosion of geopolitical relationships.
Treasury yields immediately started to climb higher with the release of the ADP employment report. This jump sent the 10-year past its high from July to a level not seen since early November (4.126%). Yields backpedaled from the high of the day. Regardless, the rates did pressure equities as $MGK witnessed a -2.1% loss on the day.
Economic data for Wednesday included the MBA mortgage Applications index and the ADP employment change report.
The weekly MBA index showed that mortgage applications fell -3.0% with both purchase applications and refinance applications falling -3.0%.

The ADP employment change showed a 324k increase in private sector payrolls in July, compared to an expected 185k and a prior 455k in June. Annual pay was up +6.2% YoY. The economy is doing better than expected and a healthy labor market continues to support household spending, says ADP’s chief economist. They expect to continue to see a slowdown in pay growth without broad-based job losses. In line with the trends we’ve discussed from the PMI data, manufacturing and services job figures are down and up, respectively.

Thursday: The stock market had a mixed showing with mega caps driving a lot of the movement. Losses were large right out the gate, but they climbed back by midday. The day was largely a reaction to a lot of earnings that were released after hours on Wednesday, more movement in the treasury market, a rate hike by the BoE, and more discussion on the Fitch ratings downgrade.
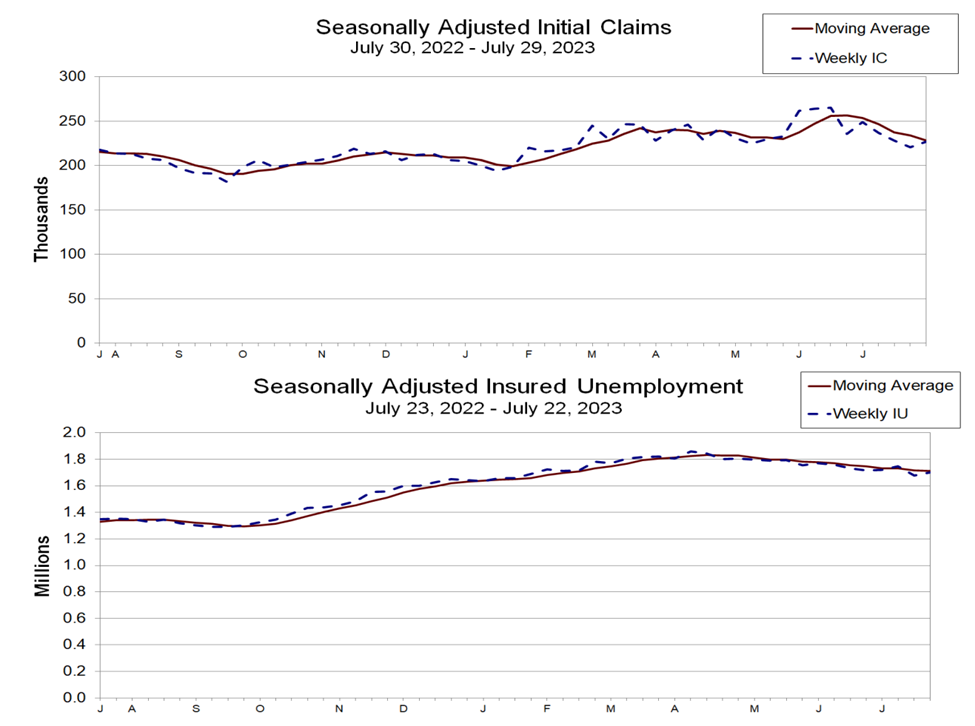
Treasuries started to widen their losses after the releases of a better-than-expected report on productivity and unit labor costs. Weekly initial jobless claims grew slightly but are still at strong levels. Meanwhile, the ISM Non-Manufacturing index showed that services sector growth decelerated in July.
Ultimately, the day ended with slim losses, showing some resiliency among calls for pullback. Economic data for the day included the Q2 productivity prelim, weekly initial claims, the services PMI, June factory orders, and the ISM non-manufacturing index.
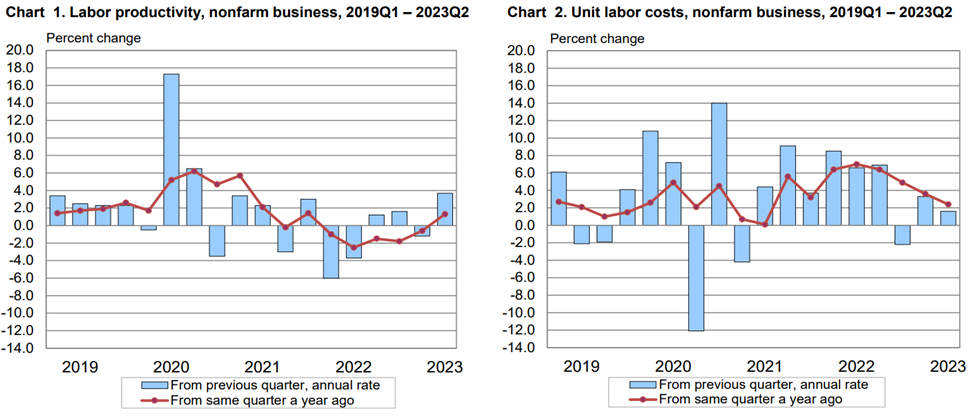
The Q2 productivity report came in at +3.7%, beating the expected +1.7% and the prior -1.2%. Q2 unit labor costs were at 1.6%, compared to an expected 2.7% and a prior 3.3%. The key here is that the pickup in productivity and deceleration in unit labor costs is a great combination for the soft-landing view.
The weekly initial claims report came in at 227k, up slightly from the expected 225k and the prior 221k. Continuing claims came in at 1.7M, compared to the prior 1.679M. Overall, employment levels are still strong, a key factor contributing to a positive economic outlook.
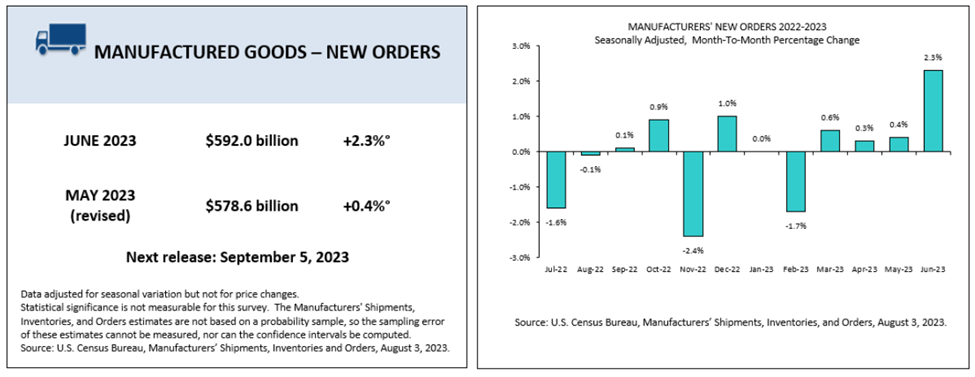
The June factory orders report came in at 2.3%, compared to an expected 2.0% and the prior 0.4%. Business spending was on the softer side in June.
The ISM Non-Manufacturing Index came in at 52.7%, compared to an expected 53% and the prior 53.9%. The services sector activity expanded in July, but at a slower pace than in Juna. The report said that the majority of respondents are cautiously optimistic about business conditions and the economy. Lastly, the S&P US Services PMI came in at 52.3, compared to the prior 54.4. Another decelerating reading.
Friday: Indices were choppy as investors reacted to earnings from $APPL and $AMAZN, the July employment report, and continued treasury moves.
Treasury rates had a pullback in response to the jobs report, which showed a slowdown in nonfarm payroll growth. That factor also had the markets consider more the idea that this may be enough for the Fed to hold rates. The 2-year note fell 12 basis points and the 10-year note fell 13 basis points.
Stocks found some upside momentum on the backs of those items, after bouncing off of the 4,500 level. Indices were trading up until selling in the afternoon hit. There was no specific catalyst for the sell off, but profit taking was likely the cause. Ultimately, indices closed near their lows of the day.
Economic data was only the Employment Situation Report. Nonfarm payrolls rose by 187k, a bit lower than the expected 200k but a bit higher than the prior 185k. Nonfarm private payrolls rose 172k, under the expected 175k and beating the prior 128k. Average hourly earnings rose by 0.4%, just higher than the expected 0.3%. The unemployment rate fell to 3.5%, beating expectations by 0.1%. The key in the report is that labor supply continues to be tight, making it difficult to achieve a more Fed-pleasing moderation in wage growth. That might not translate to another rate hike, but it does fit the notion that the Fed may be inclined to keep the policy rate higher for longer.

That’s it for my recap! If you would like to see how I am building my dividend portfolio using my predictions/strategy written here, you can read about my buys in my weekly portfolio update on this link.
And if you like updates like this, follow my Twitter or my CommonStock page where I post updates on the economic data throughout the week. I have also started a Twitch Channel called Games N Gains! Every Thursday at 6PM MST I go live to hang out, play games, and chat with y’all about stocks, charts, fundamentals, and anything else you like! I hope to see you there!
Regards, Dividend Dollars