Categories
Economics Market Recap Market Update Stock Market Strategy

Stock Market Week in Review (12/23/22) – A Weak Week to Lead Us Into The “Santa Rally”

This weekly market recap is brought to you by Koyfin, a powerful analytical tool that I am proud to partner with. Their platform is entirely customizable for whatever data you want to look at including stocks, ETFs, mutual funds, currencies, economic data releases (one of my personal favorites used often for these posts), crypto, and even transcripts of company events! Click the link above to get a special offer only for Dividend Dollar readers or go give my product review a read if you’re interested!

Weekly Review

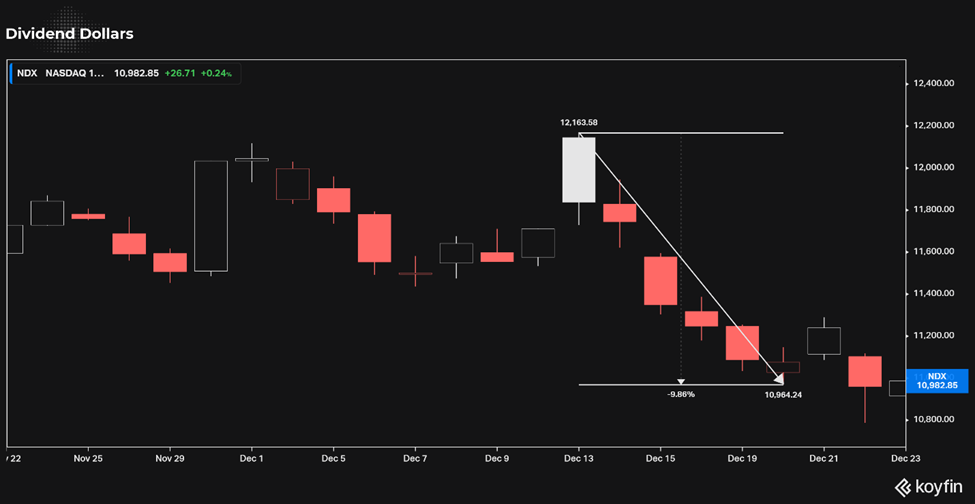
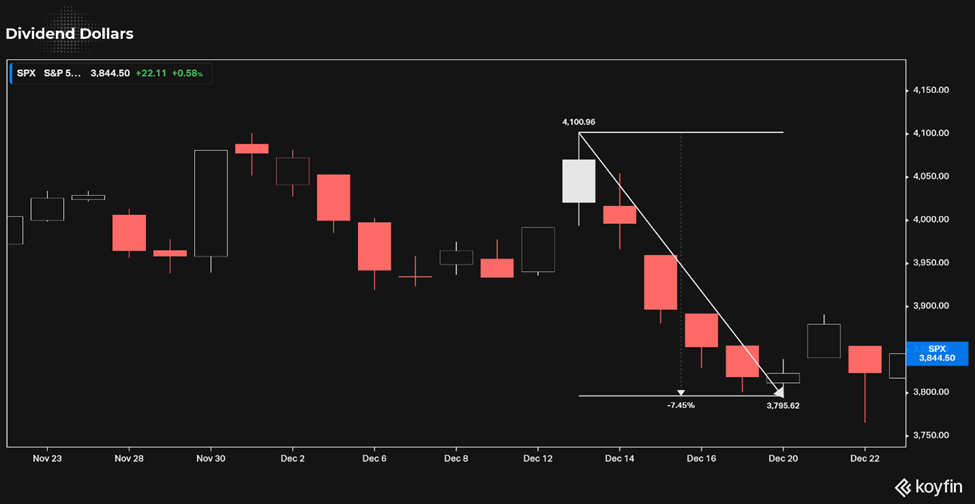
Well, this was a disappointing week, and one that solidifies the absence of a Santa Clause Rally to end the year. The S&P 500, which touched 4,100 last Tuesday, was drawn to the 3,800 level all week which proved to be a key support area.

With tax loss harvesting likely to be beginning and with sentiment falling over all due to 2023 earnings estimates feeling too high, the market was lower this week. Many analysts suggest downward earnings revisions in the coming weeks and months as the economic environment shifts.

The week started on a weaker note as the market digested a weaker-than-expected NAHB Housing Market Index report for December on Monday.

Treasury markets moved on a surprise policy change from the Bank of Japan (BOJ) on Tuesday. The BOJ announced a change to its yield curve control (YCC) policy to allow the 10-yr JGB yield to move +/- 50 basis points from 0.00% versus its prior band of +/- 25 basis points as part of an effort “to improve market functioning.”

This announcement, which came in conjunction with the BOJ’s decision to leave its benchmark rate unchanged at -0.1%, also caused some upheaval for the Nikkei (-2.5%) on Tuesday and the currency market in addition to sovereign bond markets. The yen surged as much as 4.0% against the dollar.

The Market also had to deal with some disappointing housing data before Tuesday’s open, namely an 11.2% month-over-month decline in November building permits (a leading indicator) to a seasonally adjusted annual rate of 1.342 million (consensus 1.480 million).

The S&P 500 dropped below 3,800, scraping 3,795 at Tuesday’s low before buyers showed up for a small rebound effort that ultimately left the main indices with modest gains. At this point, the indices were in a short-term oversold position. At their lows Tuesday morning, the Nasdaq Composite and S&P 500 were down 9.7% and 7.5%, respectively, from their highs last week. That oversold posture triggered some speculative buying interest in a bounce.

Things really took off Wednesday when some well-received earnings reports from Dow component Nike ($NKE) and leading transport company FedEx ($FDX) triggered some decent buying interest.

The market also got some better-than-expected consumer confidence data for December, which was another support factor for the broader market. That report overshadowed a weaker than expected existing home sales report for November that was released at the same time.

Unfortunately, the rebound move soured promptly on Thursday following some disappointing earnings results and commentary from Micron ($MU) and CarMax ($KMX), a sour Leading Economic Indicators report, and some cautious-sounding remarks from influential hedge fund manager David Tepper say he is ‘leaning short’ on the stock market.

He expects the Fed and other central banks to keep tightening and for rates to remain high for a while, making it “difficult for things to go up.” His comments resonated with market participants who recalled the hugely successful “Tepper Bottom” call he made in March 2009.

The resulting retreat was broad in nature with the major indices moving noticeably lower right out of the gate, dealing as well with rate hike concerns after the third estimate for Q3 GDP showed an upward revision to 3.2% from 2.9%. The Nasdaq, S&P 500, and Dow were down 3.7%, 2.9%, and 2.4%, respectively, at Thursday’s lows.

The S&P 500 was stuck below the 3,800 level and Tuesday’s low (3,795) for most of the session before the main indices managed to regain some of their losses in the afternoon trade. There was no specific news catalyst to account for the bounce, possibly just speculative bargain hunting.

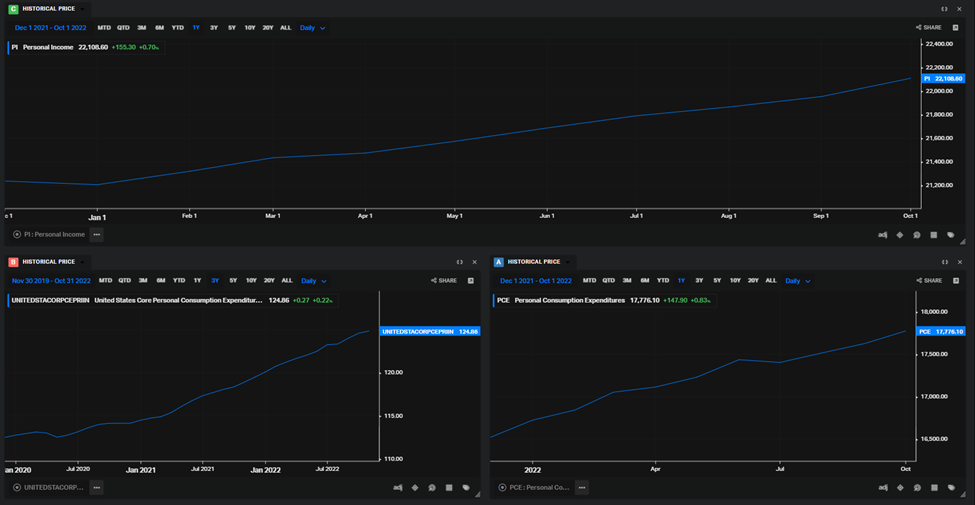
Friday’s session also started on a downbeat note after the November Personal Income and Spending Report showed no growth in real spending and PCE and core-PCE inflation rates that are still too high on a year-over-year basis (5.5% and 4.7%, respectively) for the Fed’s liking.

This report meshed with a Durable Goods Orders Report for November that was weaker than expected and was subsequently followed by economic data that showed new home sales were stronger than expected in November and that easing inflation pressures helped boost consumer sentiment in December.

Once again, the S&P 500 slipped below the 3,800 level, but soon found support as the new home sales and consumer sentiment data bolstered investor sentiment and spurred some bargain hunting interest. The major indices finished modestly higher on Friday, taking a positive first step during the Santa Claus rally period (last five trading days of the year plus the first two trading sessions of the new year).

Separately, the week concluded with the House passing the $1.7 trillion government funding bill after the Senate passed it, leaving it to be signed by the president early next week.

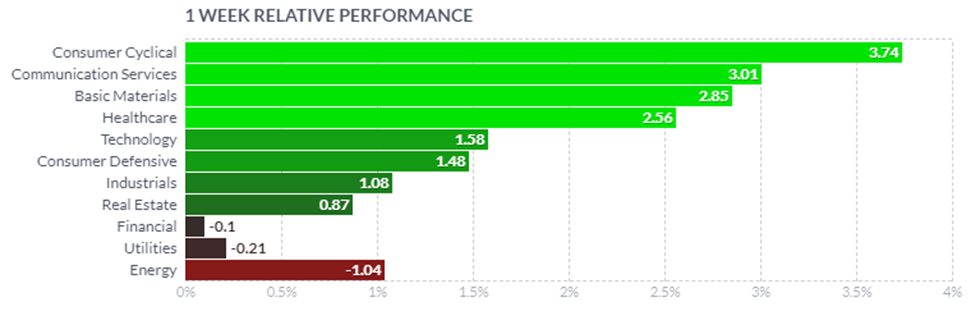
Overall, sector performance was mixed this week with 6 of the 11 sectors in the S&P ending green. Energy, financials, utilities, and a few others finished higher. The weakest links were consumer discretionary and technology which were dragged down by their mega cap components.

Dividend Dollars’ Opinion

That’s it for the recap. Now for my opinion!

Last week I was half-way right in expecting a near term bounce, however I was not expecting it to only last two days (Tuesday and Wednesday). We broke back under the bear market line and stayed there Thursday through Friday.

This here is the key to me. We are under all major moving averages AND the bear market line. There is significantly more resistance than there is support.

Next week, the 3,800 level will be key. We found substantial support at that level as everything under it was just a long wick. There are no major economic releases next week, which make me think we won’t see any crazy catalytic moves in one direction or the other.

We have some claims and housing reports, but that’s about all that’s worth watching, domestically that is. China and Japan have some releases that could bleed over into the US market.

With that, I will just reiterate what I said last week: “With the next earnings season on the way, Fed commentary continuing to spark volatility, and mixed economic data, the next move is anybody’s guess. I think a near-term bounce is likely with more downside to follow after the new year. Then, January will be the month to watch as history shows that it sets the market’s mood for the rest of the year.”

I think the action we saw on Tuesday and Wednesday very well could be the bounce, leaving more downside as my expectation. There are no huge economic releases next week, the Santa Rally so far has been week, therefore I think next week will be red mostly off of tax-loss harvesting.

However, if we open significantly higher in the earlier days of next week, I could see buyers coming in heavy off of the hopes of a strong Santa Rally to push us up through the end of the year. I think this scenario is less likely.

I would love to see more red next week so that I can buy more discounted stocks like I did this week. You can read about my buys in my weekly portfolio update here.

And if you like updates like this, follow my Twitter or my CommonStock page where I post updates on the economic data throughout the week.

Regards,

Dividend Dollars

Categories
Economics Market Update Stock Market

Stock Market Week in Review (12/16/22) – CPI and Fed Meeting

This weekly market recap is brought to you by Koyfin, a powerful analytical tool that I am proud to partner with. Their platform is entirely customizable for whatever data you want to look at including stocks, ETFs, mutual funds, currencies, economic data releases (one of my personal favorites used often for these posts), crypto, and even transcripts of company events! Click the link above to get a special offer only for Dividend Dollar readers or go give my product review a read if you’re interested!

Weekly Review

The week started strong after last week’s losses then quickly stagnated a fell as we awaited and then reacted the CPI release and FOMC policy decision in the mid-week.

Some merger and acquisition activity helped to fuel the early positivity in the week. We saw Amgen ($AMGN) acquire Horizon Pharmaceuticals ($HZNP) for $116.50 per share and Thoma Bravo acquire Coupa Software ($COUP) for $81.00 per share.

Then, the Consumer Price Index (CPI) release for November came in lower than anticipated which encouraged market upside based on the idea that a moderation in inflation should convince the Fed to slow the pace of its rate hikes. Or even place a lower ceiling on its terminal rate.

This pushed the S&P above its 200-day moving average. The Dow was up 2.1% at intraday highs on Tuesday and Nasdaq 3.8%. Those gains were eventually reined in and closed well off of the highs.

A deeper look at the CPI reading shows sticky and elevated core services in front of the FOMC rate decision to follow the next day. The major indices regroup in premarket trading on Wednesday and made some gains leading up to the FOMC announcement.

The Fed announced a 50 basis point raise to 4.25-4.50% and indicated in their Summary of Economic Projections that their median estimates for the terminal rate in 2023 and their expectations for inflation had risen. The vote to raise the fed funds rate was unanimous. The below dot plot shows 17 of the 19 Fed officials forecast a rate above 5% in 2023.

Separately, there was another announcement that the Fed would continue to let $60 billion of Treasury securities and $35 billion of agency mortgage-backed securities fall off the balance sheet each month.

Fed Chair Powell spent most of his press conference being stern on committing to 2% inflation, saying that it is going to take substantially more evidence to give confidence that inflation is on a downward path and the Fed expects to sit at its terminal rate for some time. He confirmed that we are close to level of tightening needed, but the Fed’s focus is not on rate cuts, which we can see is the case in the Economic Projections.

Overall, the Fed was much more hawkish than what the market expected. The indices faded into close on Wednesday and saw continued selling over the remainder of the week pushed by larger concern that the Fed could overtighten and trigger a deeper economic slowdown.

Thursday saw a slurry of rate hikes from other central banks across the world. The ECB, Bank of England, Swiss National Bank, Hong Kong’s Monetary Authority, and the Norges Bank all raised their benchmark rates. These hikes occurred at the same time that we received updated retail data and industrial production data out of the US and China. Both items grew concerns of global economic slowdown.

The S&P, Dow, and Nasdaq fell 99, 764, and 360 points respectively during Thursday’s freefall. Events this week showed that projections for 2023 earnings are at greater risk of downward revisions and stock prices are adjusting. The same mentality occurred on Friday with a quadruple witching day. There was broad based selling in the market and a number of moving average supports were broken.

Overall, the S&P fell 5% from where it was prior to the FOMC decision on Wednesday to where it closed on Friday. 10 of the 11 sectors in the S&P were red this week with consumer discretionary, materials, and communication services faring the worst, meanwhile the energy sector was the lone green close.

Dividend Dollars’ Opinion

That’s it for the recap. Now for my opinion!

Last week I was almost spot on with my expectations and main takeaways. I said that the CPI release and the FOMC meeting could provide huge volatility in the market, and it did. In both ways too. The market was up over 1.4% on Monday leading up to the report and another 7% on Tuesday after the report. Then the FOMC projections and meeting minutes were released, and the hawkish Fed scared the market into breaking down below a number of key moving averages.

Last week, I spoke about the straddle between the 100 and 200 SMAs and a break above could end at the trendline. Monday and Tuesday did just this when riding on the coattails of the positive CPI report. Then I spoke about how a breakdown under the 100SMA and we could see a quick drop to the 3,815 area as a gap fill.

Much to my surprise, BOTH of those situations played out. The Fed meeting showed that a majority of members raised their expectation of the terminal rate and the raised their average expected inflation rates for the next two years. This shook the markets, causing a drop from $4,020 to $3,830 in three days. Pretty dang close to the area I called.

Moving forward, there is much more technical resistance to push us down, rather than support to push us higher. Now that we’ve broken through the 200SMA, 100SMA, and are close to breaking the 50SMA, these figures are becoming resistance.

We are on the verge of breaking through the bear market line (20% draw down from recent highs) with the YTD low looking not too far behind it. We are approximately +12% away from the bull market line (20% gain over recent lows) and -7% from YTD low.

Signs are pointing lower. Key data releases next week of the Q3 GDP, jobless claims, PCE, and consumer sentiment will give us continued hints into the state of the economy and the lagging effects of rate hikes. The Fed is expecting lower GDP in the next year, maybe we see this begin with the Q3 GDP reading. This will be economic data release to watch next week in my opinion. Surprises in either direction could carry big moves in market prices.

With the next earnings season on the way, Fed commentary continuing to spark volatility, and mixed economic data, the next move is anybody’s guess. I think a near-term bounce is likely with more downside to follow after the new year. Then, January will be the month to watch as history shows that it sets the market’s mood for the rest of the year.

I would love to see more red next week so that I can buy more discounted stocks like I did this week. You can read about my buys in my weekly portfolio update here.

And if you like updates like this, follow my Twitter or my CommonStock page where I post updates on the economic data throughout the week.

Regards,

Dividend Dollars

Categories
Economics Market Update Stock Market

Stock Market Week in Review (12/4/22) – Powell Rally

This weekly market recap is brought to you by Koyfin, a powerful analytical tool that I am proud to partner with. Their platform is entirely customizable for whatever data you want to look at including stocks, ETFs, mutual funds, currencies, economic data releases (one of my personal favorites used often for these posts), crypto, and even transcripts of company events! Click the link above to get a special offer only for Dividend Dollar readers or go give my product review a read if you’re interested!

Weekly Review

The market seemed to be in a turkey coma as there wasn’t much action in the first half of the week. The market was choppy while waiting for Fed Chair Powell’s speech on Wednesday and the key economic data to follow.

The market liked what it heard in Mr. Powell’s speech and things took off in a big way on Wednesday off of his hints that the Fed may slow the pace of rate hikes.

Some will argue that he actually loosened the screws a bit. I would argue he didn’t even bring his toolbox. The market, which was waiting for a to be hit like a nail by a hammer, was relieved when he did not.

This became a rally catalyst that caused some short-covering and some chasing action as the S&P 500 broke above key resistance at its 200-day moving average.

Powell’s actual speech repeated just about everything he said following the November FOMC meeting. Some added attention was paid to his summation that “the ultimate level of interest rates will be somewhat higher than previously expected” versus the original contention that “the ultimate level of interest rates will be higher than previously expected.”

Mr. Powell’s talk (and tone) presumably weakened the fear of another 75-basis point rate hike. Granted the fed funds rate is still going higher from current levels, but market participants can smell a peak in the policy rate around 5.00% in the first half of next year. If the FOMC elects to raise the target range by 50 basis points at the December meeting, the target range will be 4.25-4.50%.

On Thursday, market participants received the October Personal Income and Spending Report, which favored the “smaller” rate hike at the same time it favored a soft landing possibility.

Personal income increased 0.7% month-over-month in October and personal spending jumped 0.8%. The PCE Price Index was up 0.3% month-over-month and the core-PCE Price Index, which excludes food and energy, increased 0.2%.

On a year-over-year basis, the PCE Price Index was up 6.0%, versus 6.3% in September, and the core-PCE Price Index was up 5.0%, versus 5.2% in September.

The big rally effort slowed as market participants contended with the notion that the upside moves might have been an overreaction and that the growth environment is going to be challenging given the past rate hikes and the rate hikes that are yet to come.

A 49.0% reading for the November ISM Manufacturing Index, which is the first sub-50% reading (the dividing line between expansion and contraction) since May 2020, hurt some of the rebound enthusiasm.

The November employment report on Friday also tested the rally. Nonfarm payroll growth was higher than expected, the unemployment rate held near a 50-year low of 3.7%, and average hourly earnings increased at a robust 0.6% month-over-month, leaving them up 5.1% year-over-year.

The report itself was good news from an economic standpoint, yet the market saw it as bad news as it gives more room for the Fed to slow the economy with rate hikes. The report signals higher for longer with respect to the target range for the fed funds rate.

The initial retreat following the employment report saw the S&P 500 breach its 200-day moving average, but by Friday’s close the index reclaimed a position above that level. All in all, this week was a win for the bulls given that the market showed nice resilience to selling efforts and the S&P 500 held the line at that key technical level, next is the downward trend line 👀

8 of the 11 S&P 500 sectors closed with a gain on the week. Communication services and consumer discretionary enjoyed the biggest gains. Energy, utilities, and financials were the lone sectors in the red by the end of the week.

In the Treasury market, there were big down swings predicated on the thinking that maybe the Fed won’t have to raise rates as high as feared. The continued inversion along the yield curve reflects the festering concerns about the Fed raising rates into a weakening economy and inviting a recession. The 2-yr note yield fell 19 basis points to 4.29% and the 10-yr note yield fell 18 basis points to 3.51%.

Dividend Dollars’ Opinion

That’s it for the recap. Now for my opinion!

As I stated last week, we just barely broke above the 200-day EMA. We opened this week below it and would have finished there if the market hadn’t rallied so hard off of Powell’s speech. I even called that we could gap fill to the 4,080 area, and we did!

I’m not trying to make a habit out of predicting things, just simply share with you what I’m noticing. And I’m noticing that an end of year rally could push us slightly higher to the mother of all trendline’s. The red line in my chart below has been rejected every time since ATHs.

We could very easily stay fighting for that trend line through the end of the year before a significant breakout happens. But when it does happen, the direction is anybody’s guess. My money is on down.

Here’s why: what did Powell say on Wednesday that warranted a 3% surge on the S&P? Signals of slowing rate hikes are nice… but the probability of a 50-point rate hike in December has not changed. The CME Fedwatch tool showed a 75% probability of a 50-point hike last week. The probabilities for a smaller hike in the February meeting were fairly unchanged as well.

People all over are anticipating a “Fed Pivot”. But the Fed is far from pivoting. A Fed Pivot happens when the Fed reverses their monetary policy stance and occurs when the underlying economy has changed to such a degree that the Fed can no longer maintain its policy.

What on Wednesday suggested that this was the case? We are still a ways away from the peak rate and even then we will be at that rate for sometime before a rate cut is imminent. So why did the market bounce as it did following the speech?

The main reason is that expectations were low. We expected him to stay hawkish, instead we got optimistic. To me, playing the expectations game is silly. Rates are rising, and they will be staying there for a while. This will eat at companies’ earnings and sooner or later will be reflected in stock prices.

Be ready for deals, the technical indicators say a dip is coming. Worse yet, a recession is still not out of the picture.

I think that inflation is still a larger problem than the market anticipates. We have seen the market move higher on “better-than-expected” inflation readings where inflation is still over 7% and CPI has yet to peak.

The Fed may lessen the size of the rate hikes, but we are a long way away from ever having rates decreased. Till then, the market is at risk of entering a very serious recession.

The Fed is trying to engineer a soft-landing and so far they have done a great job of it.

However, the longer rates stay high, the closer we may get to seeing the Fed’s planned economic slow down go too far. GDP, employment, real incomes, etc. These things will start to waiver, earnings will start to miss, and the market will start to look quite overbought at these levels which will kick off some serious selling and capitulation.

Because of this, I am short with a position in $SDS and $SPXS and am holding more cash than normal. The short is only 2% of my portfolio and the cash is 10%. I’ll be adding to this short and cash position through to the end of the year if we remain trending up, but I think we are getting closer to a flip

I constantly make moves in my portfolio according to this thesis. You can read about these moves in my weekly portfolio update here.

And if you like updates like this, follow my Twitter or my CommonStock page where I post updates on the economic data throughout the week.

Regards,

Dividend Dollars