Welcome back to the weekly Dividend Dollars portfolio review, and a very special one at that! You’ll notice within the screenshot of my portfolio that the general structure has changed a little bit. I am starting to implement a new strategy! I am quite excited about the new direction of the portfolio, so read on to see what we’re doing!
This portfolio update is brought to you by Sharesight, a portfolio tracking tool that I am happy to partner with. Their platform makes tracking trading and dividend history, understanding your performance, and saving time a breeze. I wrote a review of the product that you can read here if you’re interested in learning more! Click the link above or the picture below to get a special offer only for Dividend Dollar readers!


Here at Dividend Dollars, our investing approach is a dividend growth strategy with aspects of value investing and fundamental analysis. I am a young investor in my 20’s and by sticking to this strategy over the long term, the magical powers of compounding are on my side. This allows me to more easily build substantial positions in dividend paying stocks over time, which will one day help me reach the ultimate goal of being financially free through the sources of passive income they provide. You can read more about the strategy here. Let’s dive into the portfolio review!
Portfolio Value
To date, I have invested $15,290 into the account the total value of all positions plus any cash on hand is $15.712.20. That’s a total gain of 2.76%. The account is up $177.46 for the week which is a 1.14% gain.


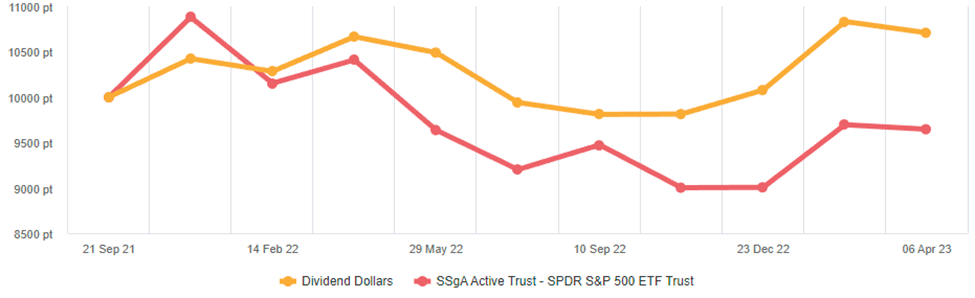
We started building this portfolio on 9/24/2021 and when compared to the S&P 500 we are outperforming the market so far! Within that same timeframe, the S&P 500 is down -7.13% which puts us 9.89% higher than the market! I love tracking my portfolio against a benchmark like the S&P. The above chart comes from Sharesight which makes portfolio and dividend management a breeze!
We added $120 in cash to the account last week, trades made will be broken out below.
Portfolio


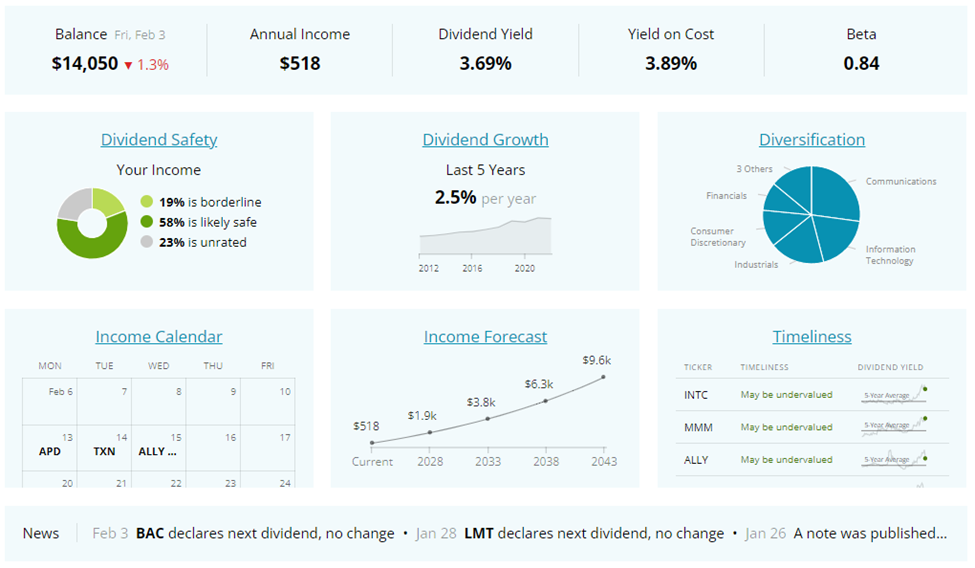
Above is a dashboard of the portfolio that tracks annual dividend income, yield, beta, dividend growth, and more.
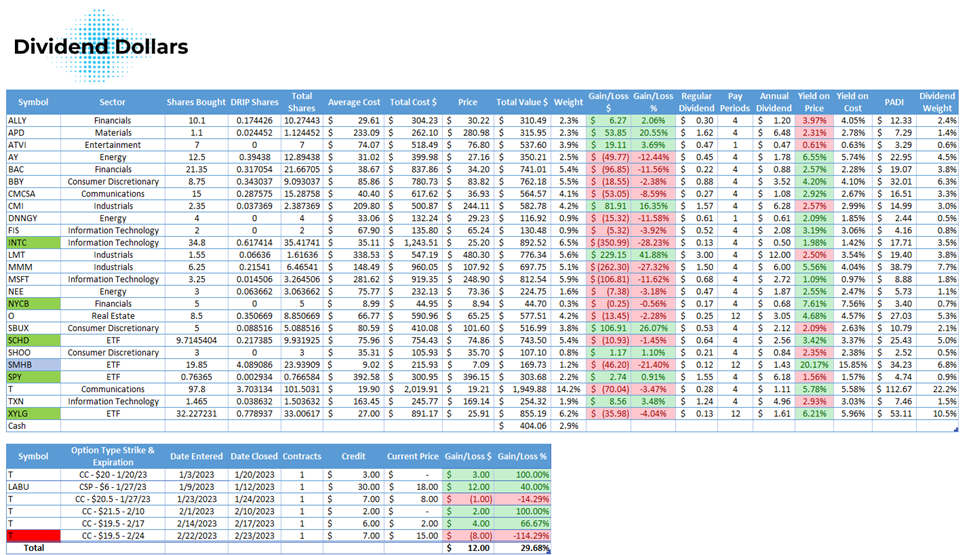
Below is a table of everything we are invested in so far. There you can see my number of shares, shares bought through dividend reinvestments, average cost, gains, and more. The tickers in green are positions that I bought shares in this week, the blue ones are positions that I reinvested dividends into, the yellow ones are positions that announced a dividend increase this week, and the red are positions that I trimmed. Our PADI decreased from $638 to $532. This large decrease was intentional and part of the new strategy I mentioned above.

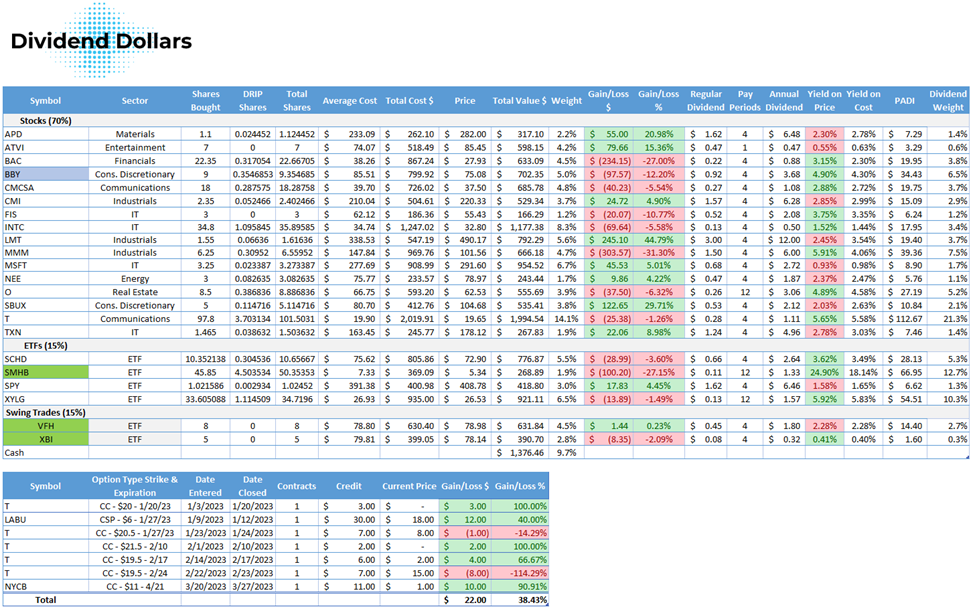
So what is this new strategy, what has changed? Overall, I’m being pickier about the allocation percentage of my capital to different aspects of the portfolio. 70% of my capital will go to my stock picks which coincides with my long term strategy.
I have been reading a number of books like CommonStocks & Uncommon Profits, The Joys of Compounding, 100 Baggers, One Up On Wall Street, and many others. These books have inspired me to be pickier with my individual stock holdings and narrow down my number of positions. As I continue to study these investors and use their lessons to develop my own long-term stock picking strategy, I will create an excel sheet/dashboard that will allow me to track relevant qualitative and quantitative information such as leadership quality, cash flow generation, debt levels, capital allocation, margin of safety, intrinsic value, and more. There’s a lot of work I need to do to get to that point, but we are in the process of upgrading our strategy!
The other 30% will be equally split between ETFs and a new swing trade strategy. The 15% in ETFs will allow me to continue investing in the ETFs that afford me a level of diversity and dividend income that I will continue to grow.
The other 15% will be allocated to a trend following strategy inspired by legendary trader Richard Dennis. I have been studying him and his Turtle Traders for sometime and am working on article to publish the specifics about my strategy for these funds. That should be out soon, so stay in touch with this website or my Twitter account. I have morphed his strategy into a variation that will allow me to follow trends in dividend paying ETFs. The goal with this strategy is boost the medium term gains of my portfolio and use any gains over the allotted 15% to reinvest into my stock and ETF picks.
I look forward to this new phase of evolving my portfolio and am excited to bring you guys along with me!
Dividends
This week we received two dividends: $8.60 from $BBY and $2.27 from $O.
In my portfolio, all positions have dividend reinvestment enabled. I don’t hold onto the dividend, I don’t try to time the reinvestment, I just let my broker do it automatically.
Dividends received for 2023: $144.74
Portfolio’s Lifetime Dividends: $555.14


Trades
Obviously, because the restructure and the goal of cutting down on some of my positions, this was a week of selling. The positions I sold were either intended shorter term holdings or positions I felt I hadn’t researched enough to earn a spot within my portfolio. The short list has been chosen!
Full details for my trades are below:
- April 4th, 2023
- SPDR S&P 500 ETF ($SPY) – added $10 at $407.83
- Global X S&P 500 Covered Call & Growth ETF ($XYLG) – added $10 at $26.47
- Schwab US Dividend Equity ETF ($SCHD) – added $10 at $72.68
- ETRACS 2xMonthly Leveraged US Small Cap High Dividend ETN ($SMHB) – added 1 share at $5.37
- April 10th, 2023
- ETRACS 2xMonthly Leveraged US Small Cap High Dividend ETN ($SMHB) – added 2 shares at $5.34
- April 13th, 2023
- New York Community Bank ($NYCB) – Sold 130 share position at $8.94 for a 18.46% gain of $181.10
- Orsted ($DNNGY) – sold 4 share position at $29.99 for a 7.26% loss of $9.73
- Atlantic Infrastructure ($AY) – sold 13.09 share position at $27.72 for a 6.15% loss of $24.96
- Steve Madden ($SHOO) – sold 3.01 share position at $35.02 for a 0.23% loss of $0.24
- Ally Financial ($ALLY) – sold 13.27 share position $26.47 for a 4.80% loss of $18.00
- SPDR S&P Biotech ETF ($XBI) – added 5 shares at $79.81 under the trend strategy
- Best Buy ($BBY) – reinvested dividend
- April 14th, 2023
- Vanguard Financials ETF ($VFH) – added 8 shares at $78.80 under the trend strategy
Next week I will look to continue my weekly buys into $SPY, $SCHD, and $XYLG and watch for opportunistic adds as well as trend opportunities. I’ll be looking to add to my redder positions in $MMM, $BBY, $FIS, and $INTC to take advantage of the coming ex dividend date.
Summary
That is it for the update this week. Big week for DividendDollars!
The market recap and outlook will be posted later this week and provides tons of information on what macro statistics I look at to keep a temperature gauge on the market and inform my portfolio movements. Read last week’s here while you wait for the new one!
I will also work on finishing my write up on the trend following strategy to share with you, so stay tuned for that.
Let me know what you think of the progress so far, share with me your progress and questions, interact with me on Twitter and CommonStock and other socials using the links below!
Thank you for reading! See you next week and stay safe!
Regards,
Dividend Dollars