


This weekly market recap is brought to you by Koyfin, a powerful analytical tool that I am proud to partner with. Their platform is entirely customizable for whatever data you want to look at including stocks, ETFs, mutual funds, currencies, economic data releases (one of my personal favorites used often for these posts), crypto, and even transcripts of company events! Click the link above to get a special offer only for Dividend Dollar readers or go give my product review a read if you’re interested!

Dividend Dollars’ Outlook & Opinion
Last week, we expected the market to be fairly bullish and anticipated some hesitancy in price action due to the approaching Fed meeting. This was spot on as the market made fair games at +0.7% this week.
59 companies of the S&P 500 reported their Q2 earnings. 48 of them beat EPS expectations. So far, reporting companies have beat EPS 79% of the time and revenue beats 55% of the time. This, paired with positive June retail sales report and continued low unemployment statistics spurred positive price action in the first few days, some of those gains were later given up on Thursday.
From a technical stand point, equities were kept down in April and May (white box) by the regional banking issues and debt ceiling battle. As banking worries subsided and a debt ceiling deal was reached, market breadth began to expand and a week later the +20% mark was reached, triggering the start of a new bull market. The bullishness in the market (green box) began the same day the debt ceiling deal was announced. It also coincides with June 1st being only the second day that the VIX closed below 16. It has closed below that every day since.

Price action this week had us push above my .786 fib level, we came back on tested it on Thursday and bounced higher on Friday. A good confirmation of support at that level in my opinion. Next area of resistance will be in the blue 4,580 – 4,630 range created by the peak in price last March. I expect heavy resistance here, because after that is cleared, new all time highs are the next logical target, yet there are still uncertainties for equities and the economy that has the potential to rear its head and change sentiment. If there’s potential for a 5-10% correction, the time for it to occur may be getting close.

Market sentiment indicators mostly deteriorated this week. SPX open interest change, VIX and SPX open interest put call ratios, VIX volume put call ratio, equity VPCR, and VIX futures all changed negatively this week, half of them deteriorated from moderately bullish levels to neutral levels while the other have went from neutral to moderately bearish levels.
Data is softening and earnings results are heading back towards longer-term trends. The bottom line is that economic data was most disappointing this week and earnings kicking off, bullish momentum appears to have moderated, but still hasn’t disappeared. Technically speaking, a pause in the rally next week seems to be evident in the chart and indicators. Any pause may only be temporary, depending on the reception of the FOMC rate decision on Wednesday and GDP for Q2 estimate on Thursday. I’m leaning moderately bullish to neutral for the next week in the market.
Weekly Market Review
Summary: The market brought us another winning week this week! Buying interest was broad as mega-caps underperformed due to profit taking and valuation angst ahead of mega-cap earning reports. $MGK fell 1% this week while the $RSP gained 1.4%.
Tesla and Netflix were laggards with some consolidation in price action after their better-than-expected earnings. Taiwan Semiconductor was another loser after warning about inventory adjustments due to slowing market demand, they did still report better than expected results though.
Bank stocks outperformed as the heavy schedule of earnings and commentary brought up no concerns of economic headwinds. $BAC, $NTRS, $MTB, $WAL, and $USB all hit nice gains after their reports.
These results and the week’s data corroborated the view that a soft landing is possible. Initial jobless claims show continued strength in the job market. Housing and retail data were a little softer, but still didn’t sound any alarms. With the soft-landing idea intact, traders were inclined to fade the mega caps this week and buy non-tech and value stocks as evident in a number of value indices outperforming.
8 of the 11 S&P 500 sectors had gains this week. Communications and Consumer Discretionary were the standout losers while Energy and Healthcare were neck and neck for the #1 spot.

Monday: Markets had a solid day on Monday, with a spattering of tickers hitting 52-week highs. There weren’t any meaningful drivers behind the positive price action, it was really just investors forging ahead on the hopeful notion that the US economy will avoid a recessions and that the Fed is close to done raising rates.
Telecoms took a large hit amid concerns about potential liabilities related to the industry’s historical use of lead sheathed cables as noted in WSJ article that came out over the weekend. Afterwards, both companies received a number of downgrades.
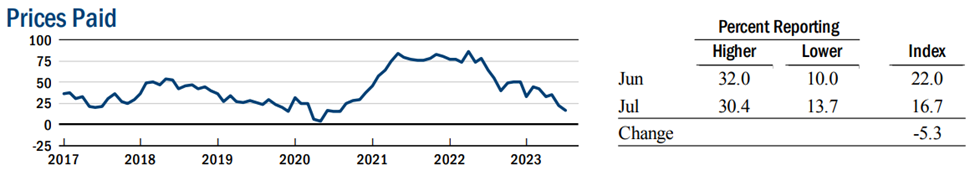
Data for the day was only the July Empire State Manufacturing Survey. The survey came in at 1.1, down from the previous reading but higher than expected. The price paid index within the survey fell to 16.7, a continued sign of price moderation.


Tuesday: Tuesday started a bit mixed, but ended with solid gains after several mega caps recovered from early losses. $MSFT was down 1% at its low and surged higher after making a handful announcements, the largest of which is an expanded AI partnership with $META.
Gains for the broader market were driven, again, by hopefulness of a strong US economy. The data for the day helped corroborate this. Bank gains also helped with a number of strong earnings.
Data for the day included the Retail Sales Report, Industrial Production, and the NAHB Housing market index.
June retail sales rose 0.2%, the 3rd straight monthly increase, but less than the 0.5% forecasted. Excluding gas and autos, sales were up 0.3% for the month. The control group of sales, which most closely resembles the consumer spending component of GDP, increased 0.6%, doubling expectations. That last figure is the key takeaway, a solid 0.6% reading is far above levels of an economy in recessionary distress.

Industrial production fell 0.5% in June, the 2nd straight monthly decline, versus expectations of remaining flat. Production still rose 0.7% during the 2nd quarter. Manufacturing was down 0.3% during June. Capacity utilization slid to 78.9%, down from 79.4% in May. The takeaway here is that most major market groups posted declined in June, showing a softening demand that has hurt the manufacturing side of the economy more than other sectors.

Lastly, the NAHB Housing Market Index came in at 56 in July, matching expectations. The previous reading was 55. Current sales and prospective buyers were higher, while expected sales were lower.

Wednesday: Markets opened slightly higher and had choppy action all day, but still managed to get some gains. There was no strength in any selling interest, despite some calls for a pullback after this big market run.
Apple made the news with a report that the company is internally testing AI tools. Goldman Sachs outperformed despite missing on their Q2 earnings. Several other banks were also notable winners on the day. Data for Wednesday included the MBA mortgage application index and Housing starts.
The MBA mortgage application index rose 1.1% after a 0.9% last week. Refinance applications were up 7% and purchase applications down 1%.
Total housing starts fell 8% MoM to an annual rate of 1.434M compared to an expected 1.475M. Single family starts were down in all regions expect the West. Building permits fell 3.7% MoM to a rate of 1.44M compared to an expected 1.472M. Permits for single family units were flat to positive in all regions. The higher financing costs of the market are creating headwinds for builders and preventing activity from being stronger in a supply-constrained housing market.

Thursday: Stocks were mixed today as concerns of being in overbought territory came up. Mega caps were weak with poor performance in $TSLA, $NFLX, and $TSM in response to their earnings reports. However, the broader market was resilient. $RSP was down only 0.1% compared to 0.7% for $SPY.
Data for the day included the weekly jobless claims and existing home sales reports.
Initial claims for the week decreased by 9,000 to 228,000 (consensus 240,000). That is the lowest level of initial claims since mid-May when the S&P 500 was around 4,100 or 11.4% lower than where it is today. Continuing jobless claims for the week ending July 8th increased 33,000 to 1.754 million. Still, employment levels remain well above recessionary levels.

Existing home sales fell 3.3% MoM in June to a seasonally adjusted annual rate of 4.16 million (consensus 4.25 million) from an unrevised 4.30 million in May. Sales were down 18.9% from the same period a year ago. The takeaway in the report is that the inventory of existing homes for sale is still tight. This is due to a strong labor market, ability to work remotely, and the jump in mortgage rates that are deterring existing homeowner’s from moving. Because there’s a lack of transacting, existing home sales are crimped by limited supply more than by weak demand.

Friday: Friday closed as a mixed day. There wasn’t outsized selling interest, but there wasn’t much buying interest either. The market felt as if we were all waiting and looking ahead to the busy earnings next week and the FOMC meeting.
Still, the broader market held up well as the $RSP was up 0.1% and $MGK was down 0.2%. There was no data for the day.
That’s it for my recap! If you would like to see how I am building my dividend portfolio using my predictions/strategy written here, you can read about my buys in my weekly portfolio update on this link.
And if you like updates like this, follow my Twitter or my CommonStock page where I post updates on the economic data throughout the week. I have also started a Twitch Channel called Games N Gains! Every Thursday at 6PM MST I go live to hang out, play games, and chat with y’all about stocks, charts, fundamentals, and anything else you like! I hope to see you in there!
Regards,
Dividend Dollars