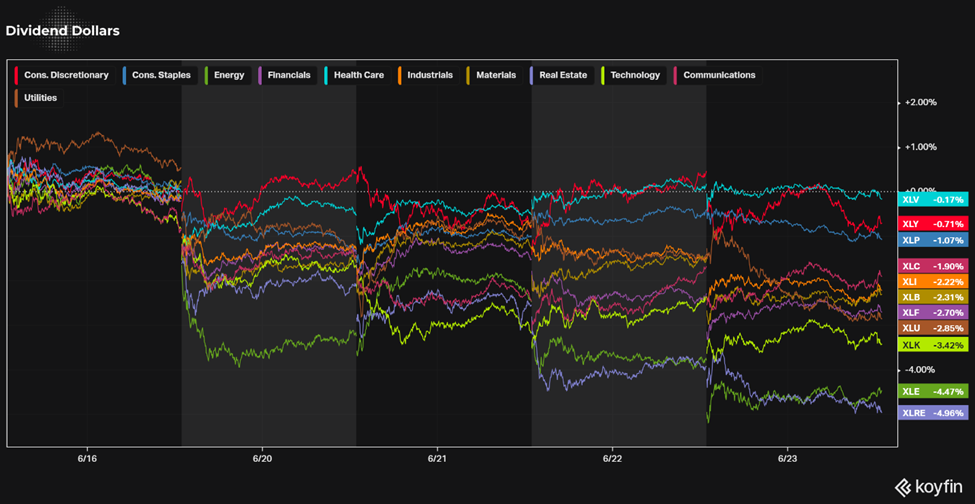
This weekly market recap is brought to you by Koyfin, a powerful analytical tool that I am proud to partner with. Their platform is entirely customizable for whatever data you want to look at including stocks, ETFs, mutual funds, currencies, economic data releases (one of my personal favorites used often for these posts), crypto, and even transcripts of company events! Click the link above to get a special offer only for Dividend Dollar readers or go give my product review a read if you’re interested!

Dividend Dollars’ Outlook & Opinion
Last week’s call of neutral to moderately bullish was a W as all the major indices are sitting at +1.4% or higher for the week. The moves higher this week we’re largely due to some worse than expected economic data releases. Though it sounds counterintuitive, the miss on Q2 GDP and JOLTS/ADP employment data had the market rethink their expectations for the Fed and Treasury yields, which caused this week’s bullishness.
Nonfarm payrolls had a negative revision to the past two months, average hourly earnings rose less than the estimate, and the unemployment rate rose higher than the estimate. The Fed has been closely watching the labor market, and this minor loss of strength shifted Fed rate forecasts more in favor of rate pauses rather than rate hikes. See the charts below from the CME FedWatch tool.
The odds of a pause in the September meeting increased from 80% to 93% this week, this would keep the rate at 525-550. The odds of keeping the 525-550 rate in the November meeting increased from 44% to 62%. The odds of keeping the 525-550 rate in the December meeting increased from 44% to 60%. These all suggest a higher likelihood of a dovish Fed for the rest of the year. Subsequently, treasury yields slid lower on this sentiment, helping stocks to edge higher.

From a technical standpoint, the S&P 500 broke above the technical 4,450 level we have been watching. It ran higher with strength on Tuesday as the JOLTS data caused a lower reaction to yields, reclaiming the 50 day SMA in the process. The market pushed higher for the rest of the week, with less tenacity, and closed right under the 0.785 fib level. That level and July’s high of 4,600 will be the next areas of resistance, while the 50-day SMA and 4,450 are now our support levels under here.

A push higher would be greatly helped by a continued move down in the 10-year yield. Yields have pulled back a bit since the high hit on August 22nd, the bad news is that the rising channel is still intact. If the rate bounces higher off of this level, selling pressure will make it difficult for equities to push higher.

Overall, this was a good week. Pending home sales, initial jobless claims, personal spending, PMI, ISM, and construction spending all beat their estimates. PCE and core PCE were in line with theirs. Consumer confidence, JOLTS, HPI, ADP employment change, Q2 GDP, and unemployment all were worse than their estimates.
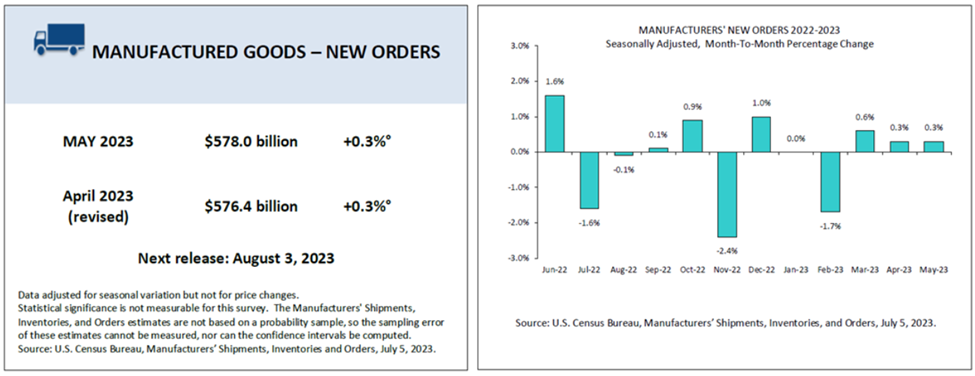
Next week brings us factory orders on Tuesday, the Fed’s Beige book, ISM, MBA mortgage, and trade balance data on Wednesday, claims and productivity on Thursday, and consumer credit on Friday. None of these will have too much influence on the market, but focus should be on the Beige Book and employment data. With bonds looking likely to be the driver in the market next week, I’m keeping my outlook of Neutral to Moderately Bullish for the week ahead.
Weekly Market Review
Monday:
Stocks started the last week of August on an upbeat note. The major indices closed near their best levels of the day on extremely light NYSE volume. The positive bias was partially fueled by carryover upside momentum from Friday’s rebound effort.
The indices were choppy as a result of fickle price action in the mega cap stocks, but they never slipped into negative territory due to broad buying. NVIDIA ($NVDA) had been down as much as 2.5% at its low of the day, but closed with a 1.8% gain.
The Vanguard Mega Cap Growth ETF ($MGK) rose 0.7%, the Invesco S&P 500 Equal Weight ETF ($RSP) rose 0.8%, and the market-cap weighted S&P 500 rose 0.6%.
3M ($MMM) was a standout winner following reports that the company is nearing a $5.5 billion settlement in the military earplugs case.
There was no economic data of note for Monday.
Tuesday:
It was another strong day for stocks on light volume. A drop in rates provided the positive catalyst for stocks. The S&P 500 climbed above its 50-day moving average after the open and closed just a whisker shy of the 4,500 level. All major indices closed near their highs of the day.
Treasury yields dropped following the release of the July JOLTS Report and August Consumer Confidence Index. Both of those reports were weaker than expected, which is a good thing in the market’s eyes as it relates to Fed policy.
Mega caps and other growth stocks led the upside charge, reacting positively to the drop in market rates. The Vanguard Mega Cap Growth ETF ($MGK) jumped 2.0% and the Russell 3000 Growth Index rose 1.9%.
A gain in Best Buy ($BBY) following its earnings results and outlook provided an additional boost to the consumer discretionary sector.
Economic data for the day included the June S&P Case-Shiller Home Price Index, the August Consumer Confidence Report, and the July JOLTS job report.
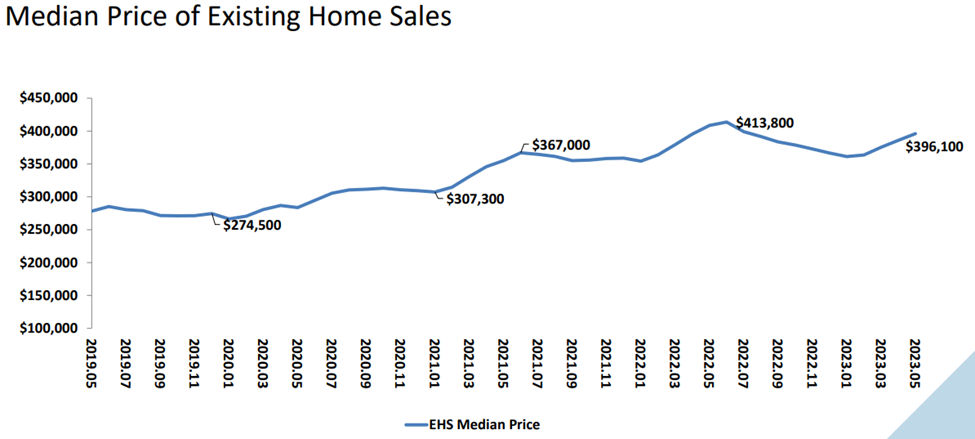
The June Home Price Index composite moved lower at -1.2% YoY, beating the consensus of 0.9%. Both the 10-City & 20-City Composite increased 0.9% MoM. Among the 20 cities, Chicago, Cleveland, and New York posted the highest YoY gains at 4.2%, 4.1%, and 3.4%, while San Francisco and Seattle posted the worst at -9.7% and -8.8%.

The Conference Board Consumer Confidence Index fell to 106.1 in August, down from 114.0 in July, wiping the gains from June and July. The decline is due to the Present Situation Index falling from 153.0 to 144.8 and the Expectations Index falling from 88.0 to 80.2. Consumers appear to be concerned about rising prices, for groceries and gasoline in particular. Expectations of 80 and lower have historically signaled a recession within the next year. The key takeaway from the report is that receding optimism about employment conditions negatively affected consumers’ view of the present situation and outlook.


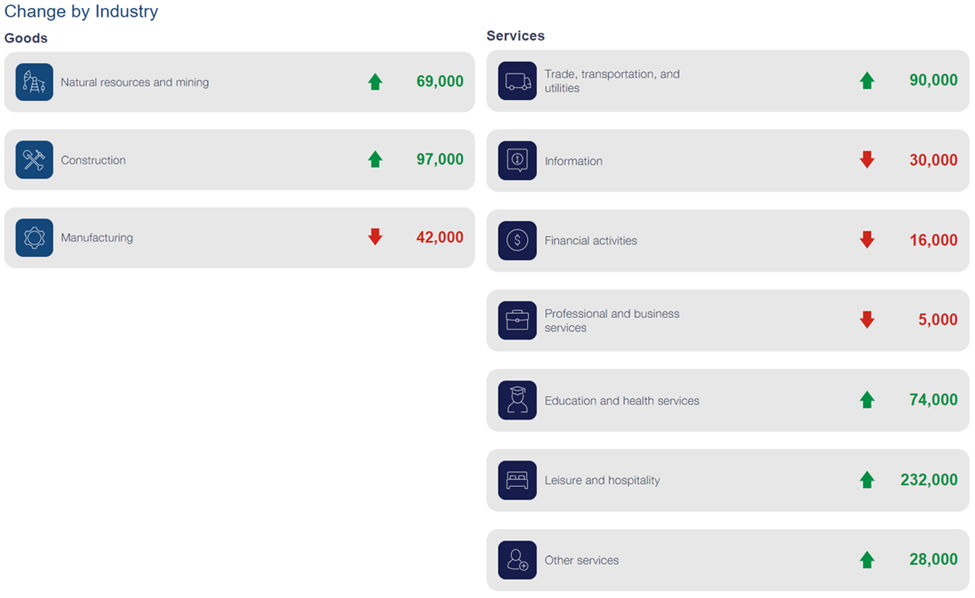
The JOLTS jobs report showed lower openings in July, down 338,000 to 8.8 million, with decreases coming primarily from professional/business services, health care/social assistance, & state/federal government. Increases came from information and transportation, warehousing, & utilities.

Wednesday:
The market hit its 4th consecutive winning session in another lightly traded day. Upside moves were less prominent compared to recent sessions. The S&P 500, which closed above the 4,500 level, and the Nasdaq Composite finished near their highs of the day thanks to support from the mega cap space.
An initial drop in market rates following the weaker than expected economic data provided added support early on. Treasury yields climbed off their intraday lows, though.
Relative strength from the mega cap space was the biggest driver of index gains. The Vanguard Mega Cap Growth ETF ($MGK) rose 0.7% while the Invesco S&P 500 Equal Weight ETF ($RSP) rose 0.3%. The market-cap weighted S&P 500 closed up 0.4%.
Economic data for Wednesday included the MBA mortgage applications, the July Pending Home Sales report, the Q2 GDP second estimate, the ADP employment report, and the trade in goods report.
Weekly MBA Mortgage Applications grew 2.3%. The increase was due to the Refinance Index increasing 3% and the Purchase Index increasing 2%. The average rate for a 30-year fixed-rate conforming mortgage moved to 7.23%.

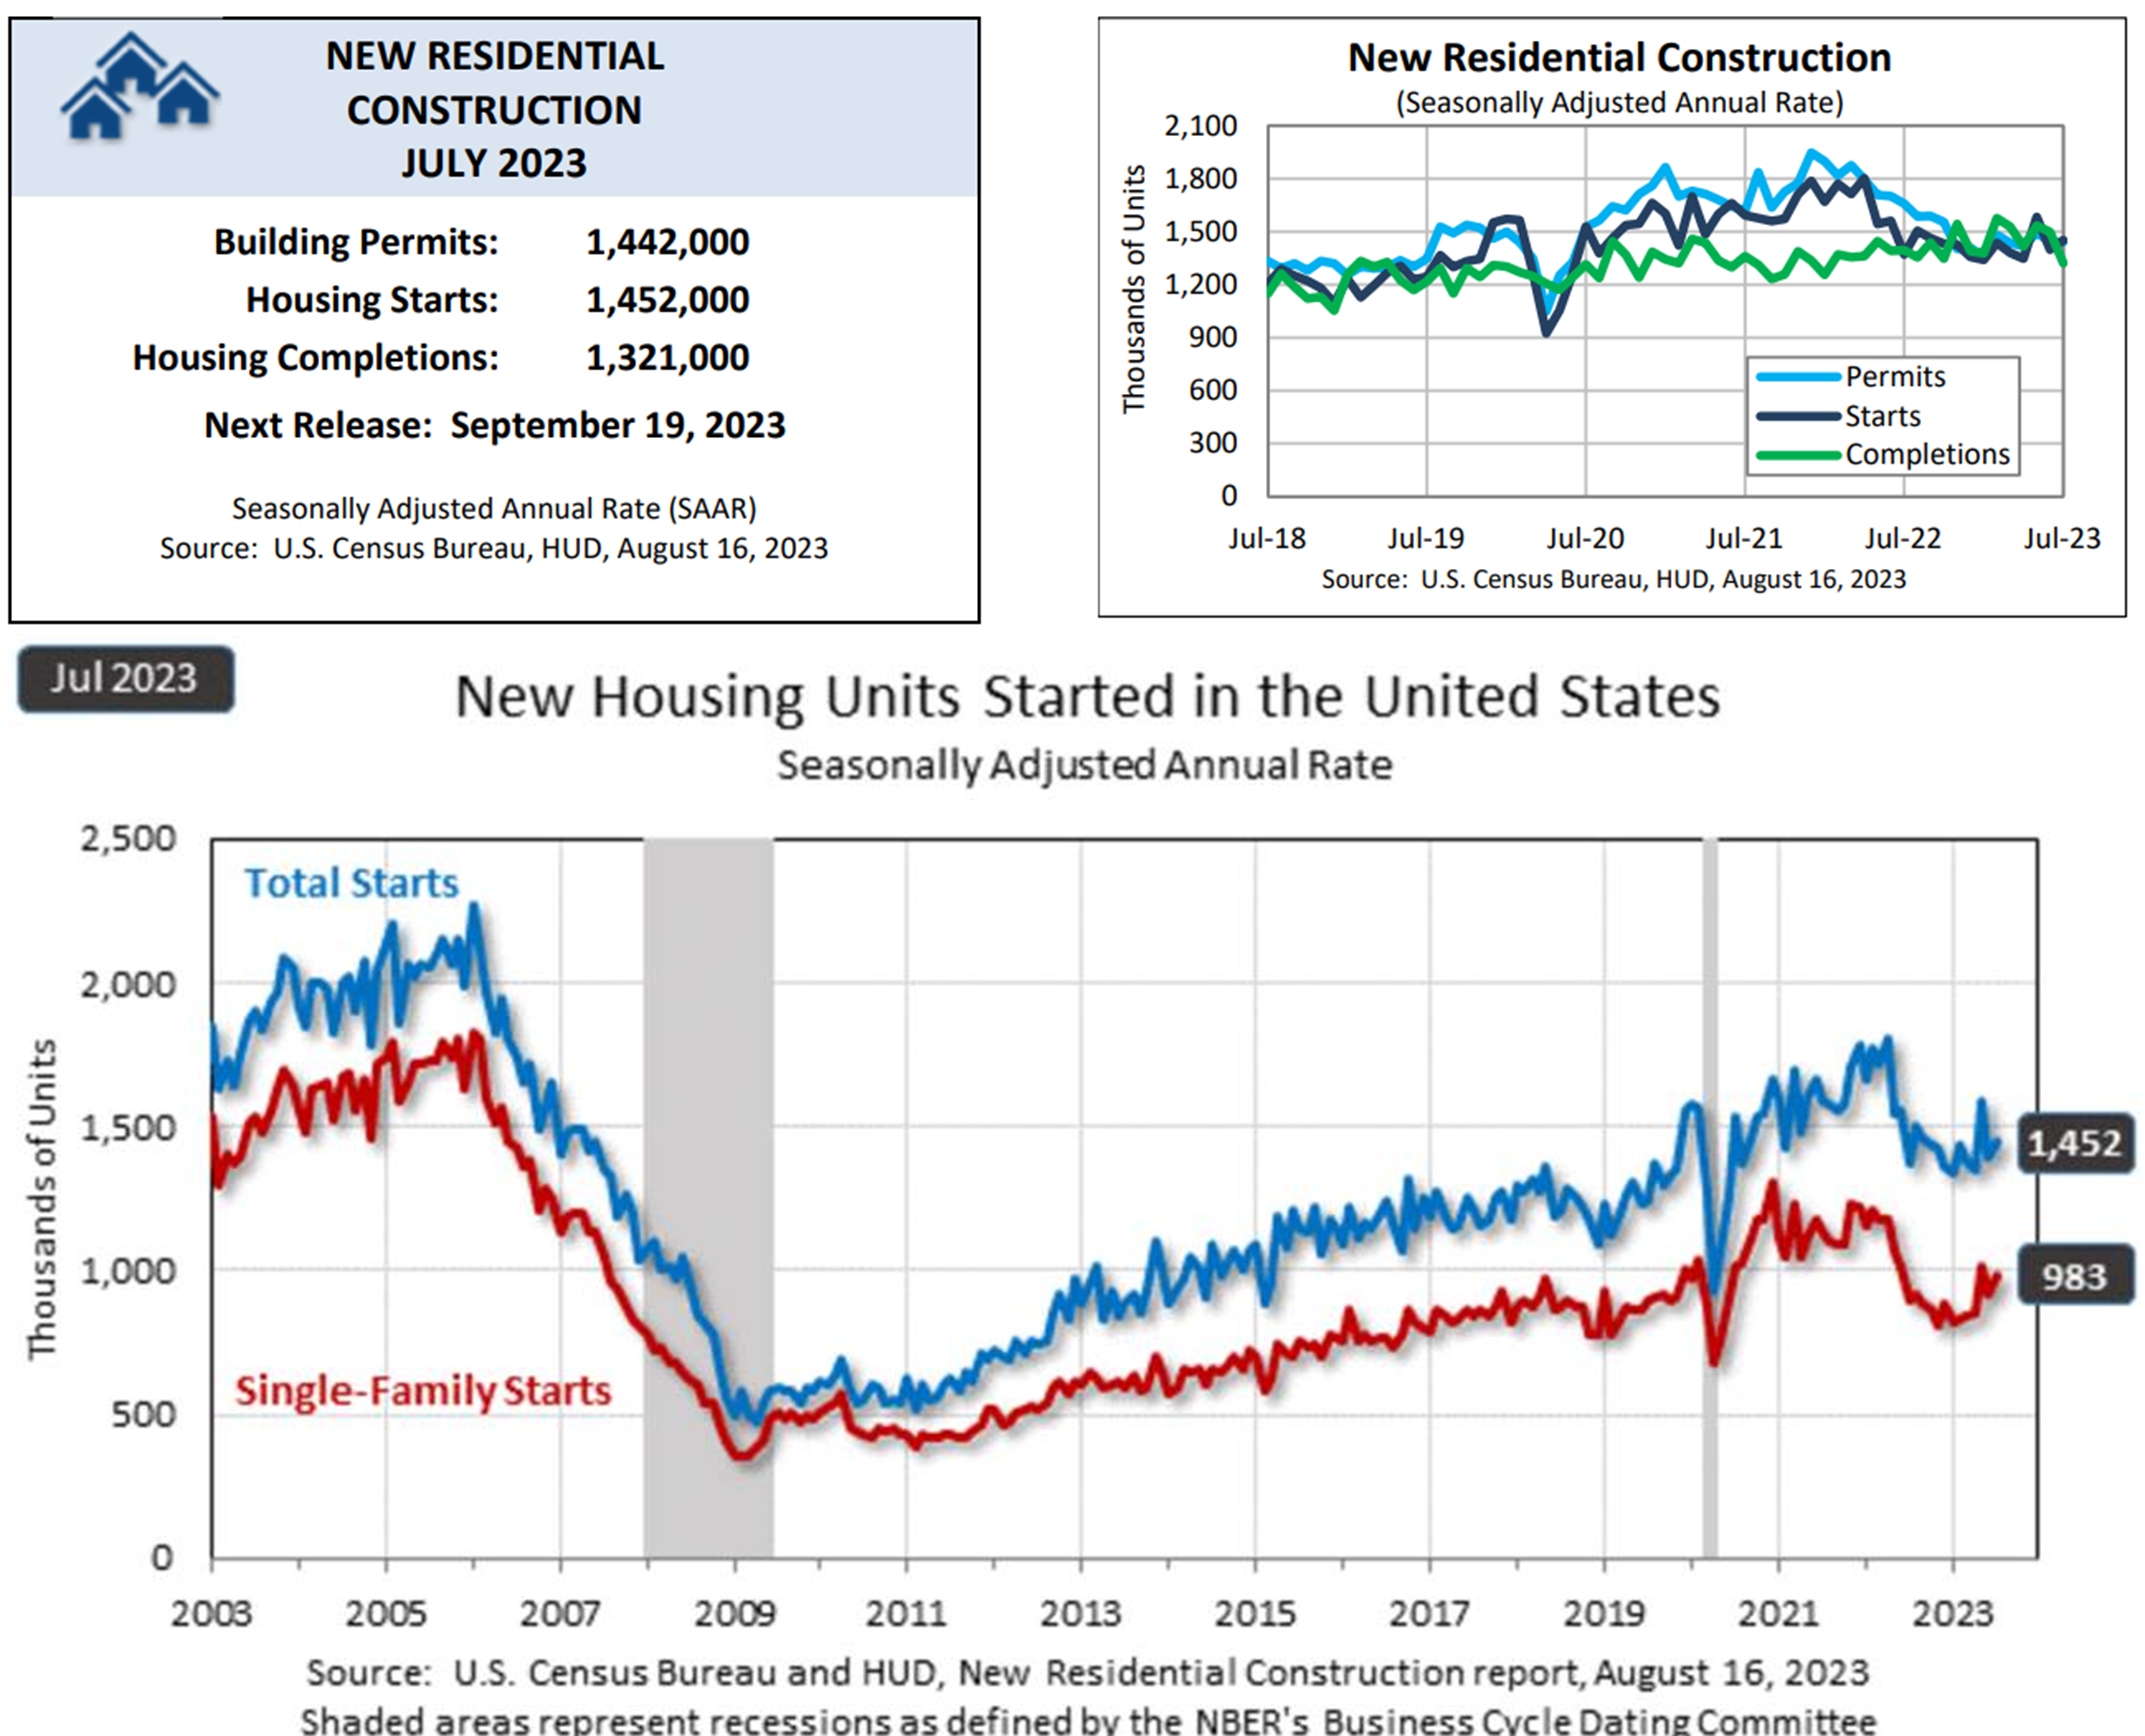
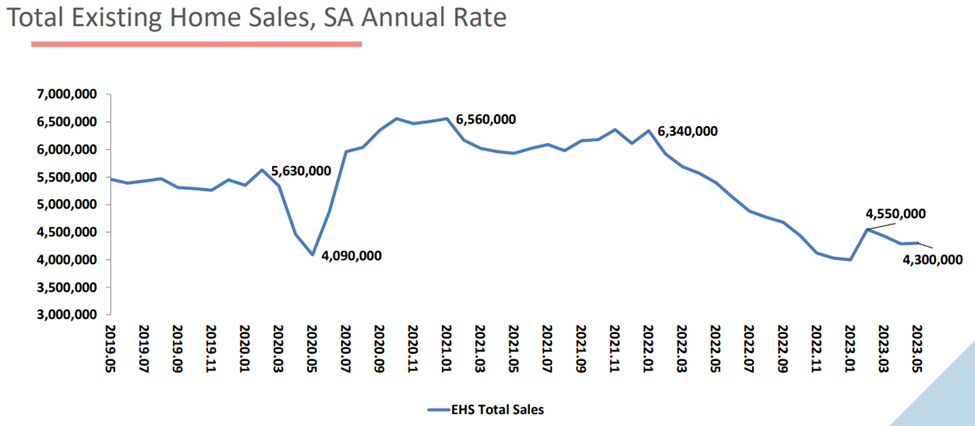
July Pending Home Sales grew 0.9%, beating -1.3% expectations and 0.4% prior reading. This is the 2nd consecutive monthly increase. The Northeast and Midwest posted monthly losses, while sales in the South and West grew. All 4 regions saw YoY declines in transactions.
August ADP Employment Change showed that job creation slowed, falling from 371,000 in July to 177,000 August & missing expectations of 200,000. The report showed that pay growth slowed for workers who changed jobs and those who stayed in their current positions. The ADP press release stated that “this month’s numbers are consistent with the pace of job creation before the pandemic.”


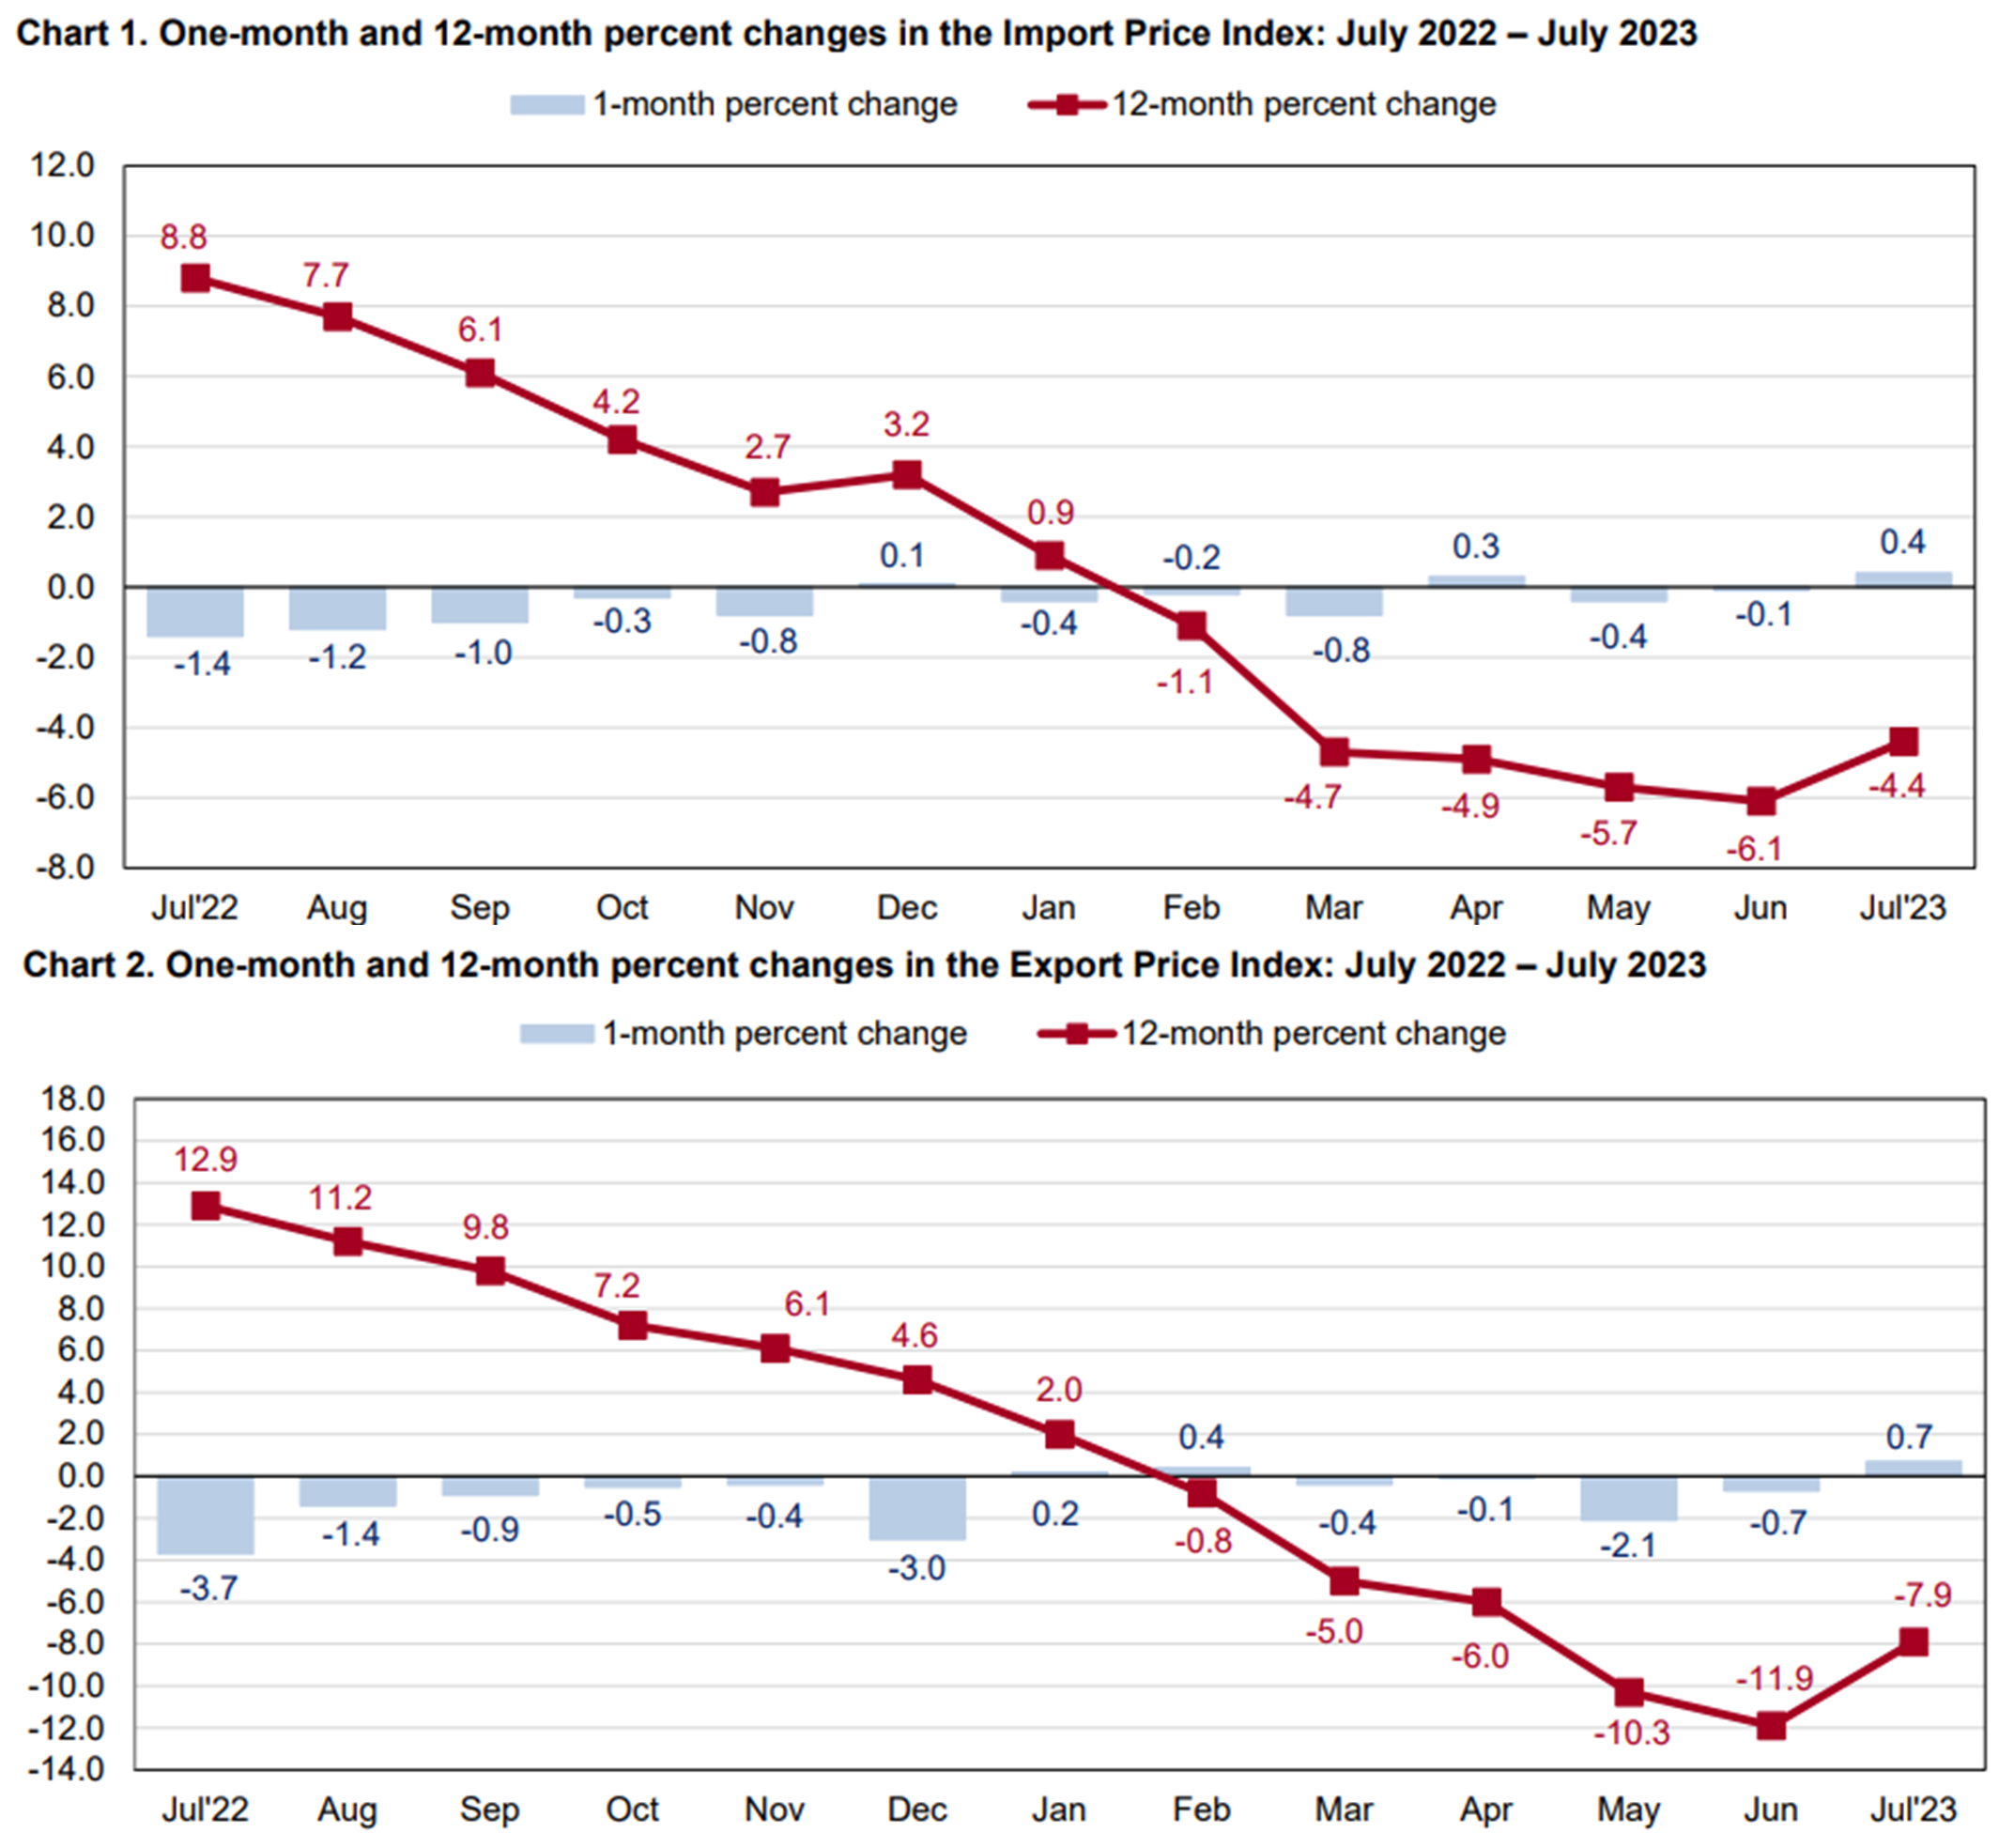
The advanced international trade in goods release showed that the trade deficit increased 2.6% to $91.2 billion in July. The increase of imports outpaced the increase of exports. Regarding inventories, the advance wholesale inventories were down 0.1% in July and the June percentage change was revised down from -0.5% to -0.7%. Advance retail inventories were up 0.3% in July and the June percentage change was revised down from 0.7% to 0.5%.

The Q2 GDP estimate was revised lower from 2.4% to 2.1%, whereas economists expected it to remain unchanged. The revision was due to downgrades in inventory investment & business spending on equipment & intellectual property products. The pace of growth remains above the Feds non-inflationary growth rate of approximately 1.8%. Despite that, the report fits the soft landing scenario; also, there were downward revisions to the inflation readings, which is something that will continue to drive the market’s belief that the Fed can refrain from another rate hike.

Thursday:
The market’s winning streak was broken on Thursday. The market had moved higher before upside momentum slowly dissipated. The S&P 500 and Dow Jones Industrial Average both closed with a loss near their worst levels of the day.
In general, big moves were reserved for individual stocks with catalysts. Retailers Dollar General ($DG) and Five Below ($FIVE) sank after reporting quarterly results that featured below-consensus guidance. CrowdStrike ($CRWD) and Salesforce ($CRM), meanwhile, registered sizable gains after their earnings reports.
Economic data for the day included the weekly initial claims report and the July PCE reading.
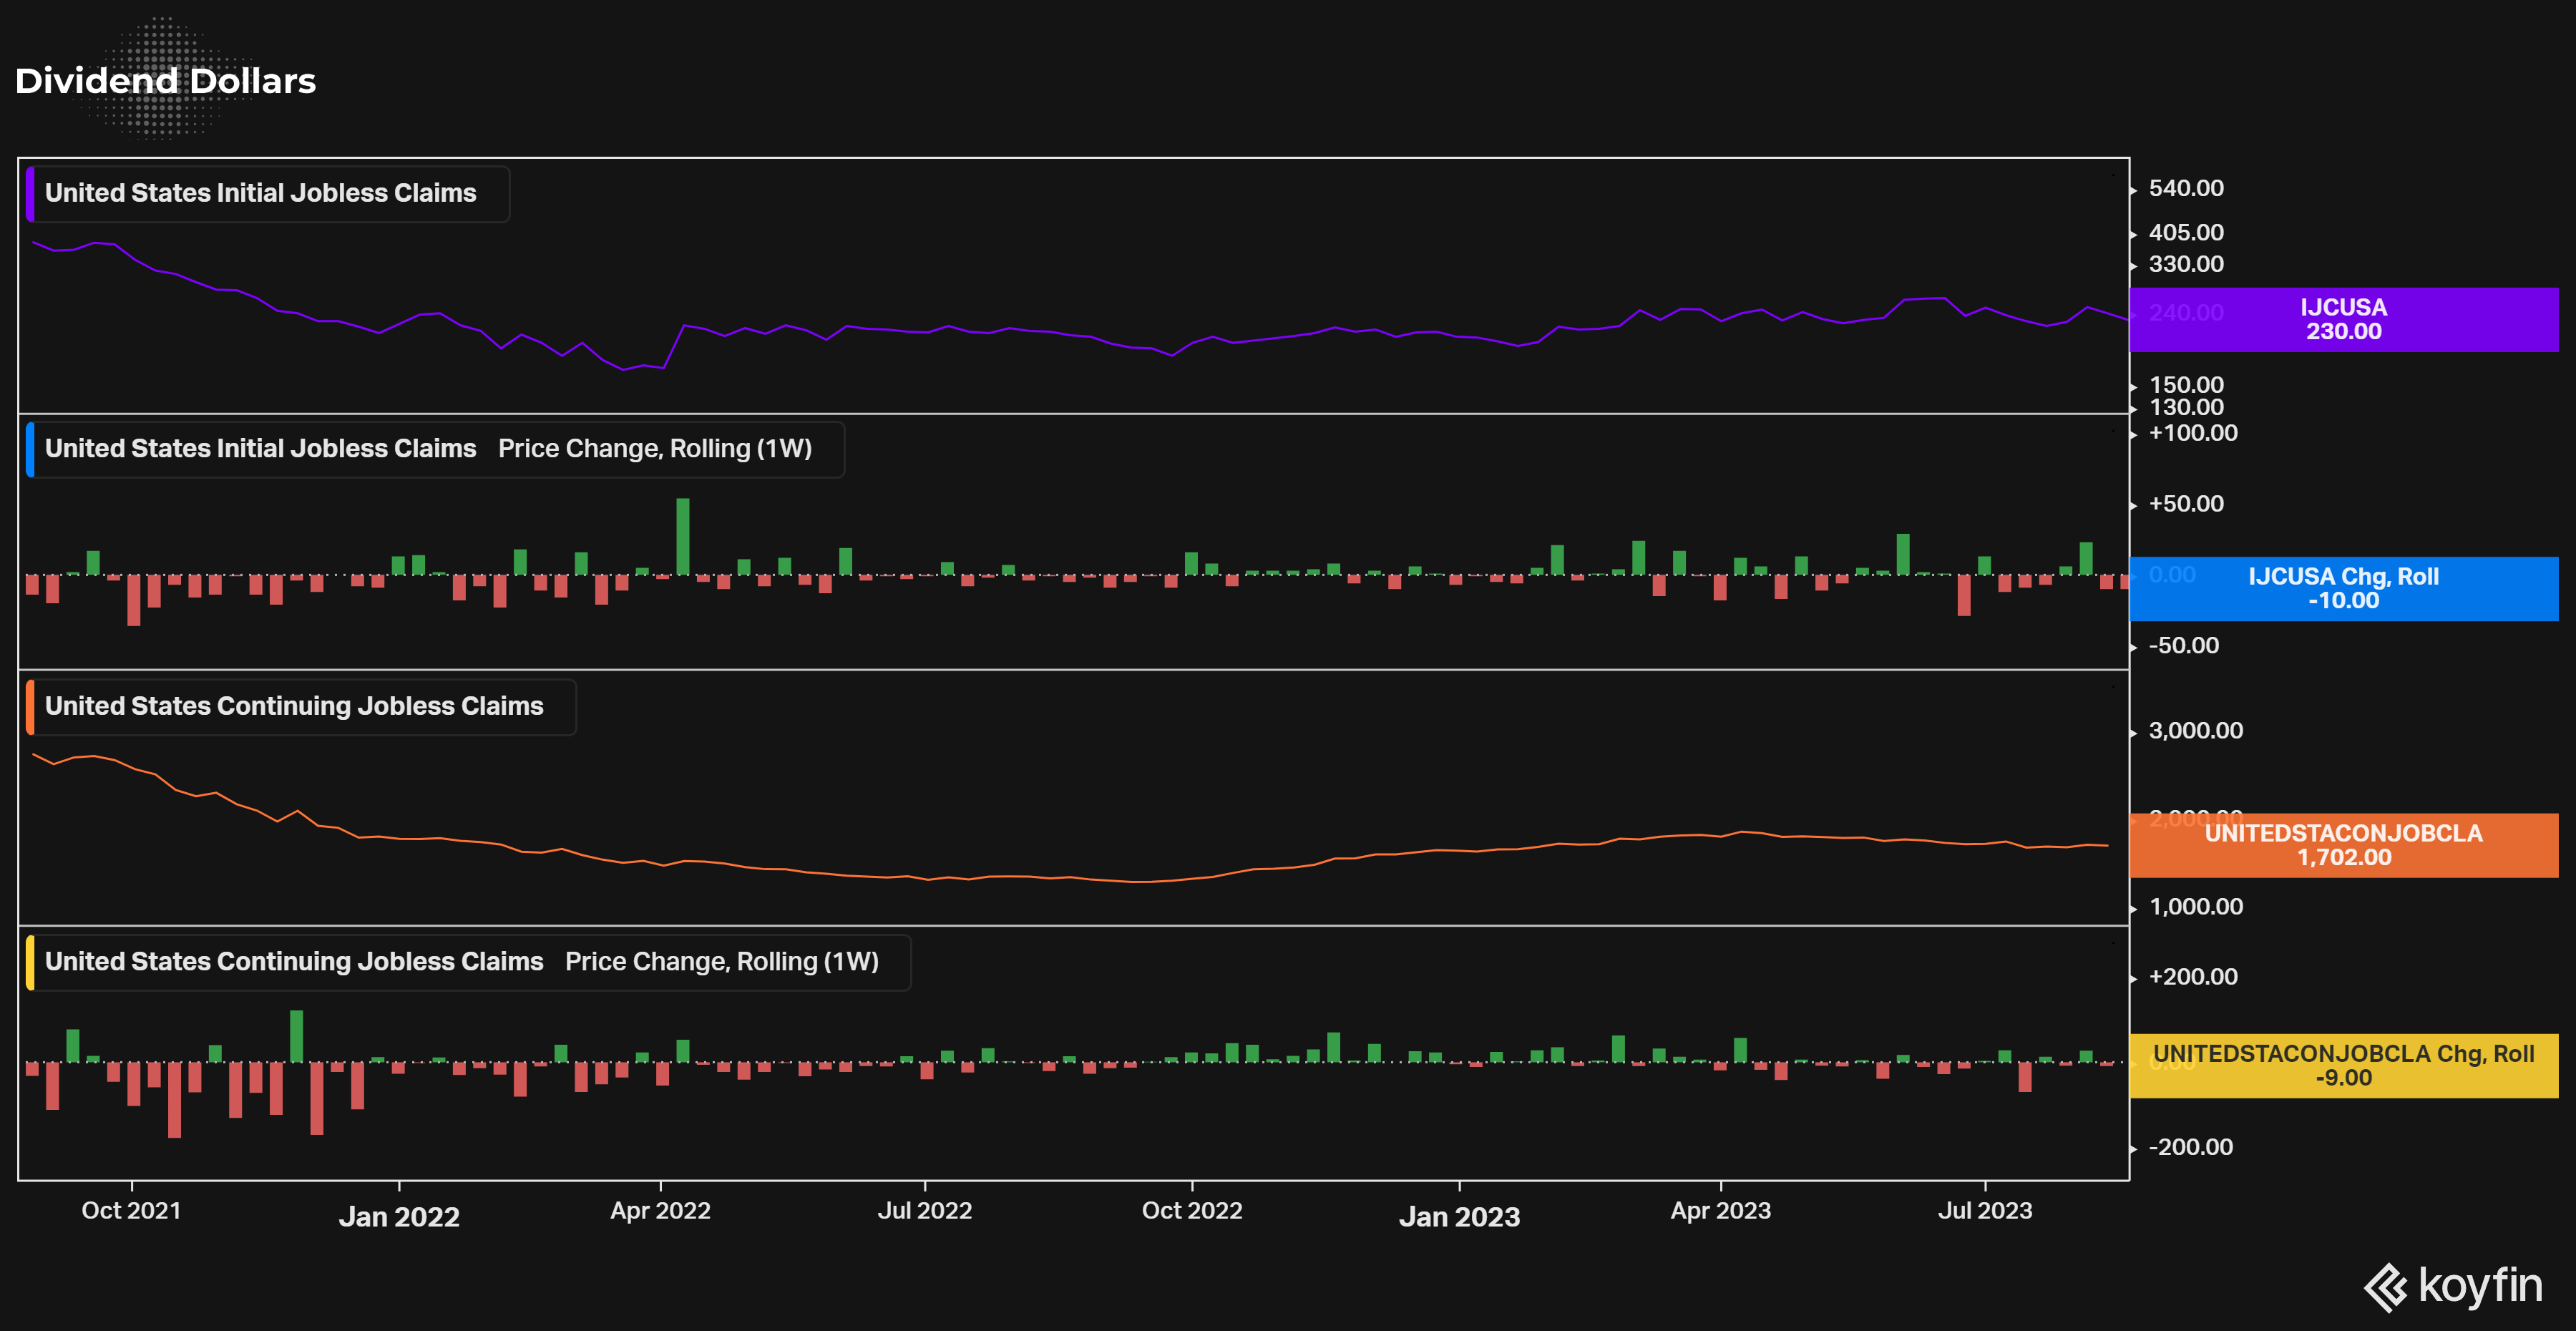
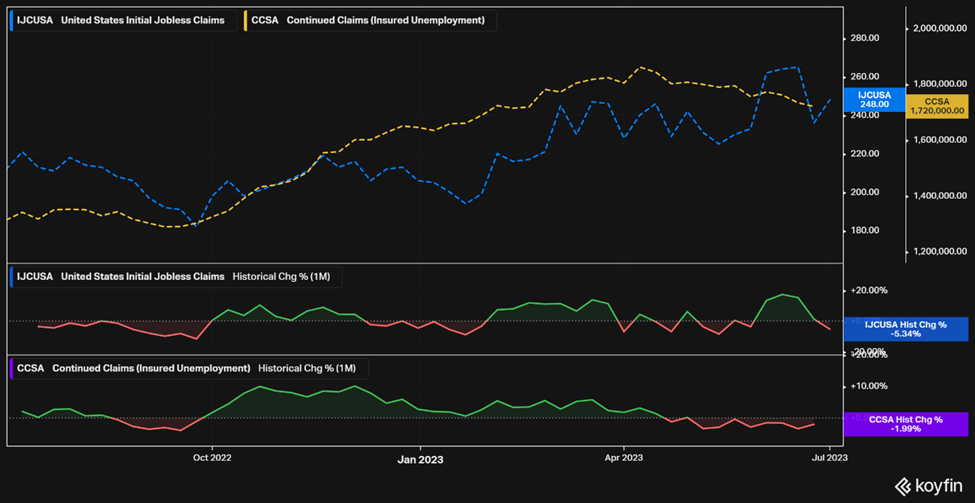
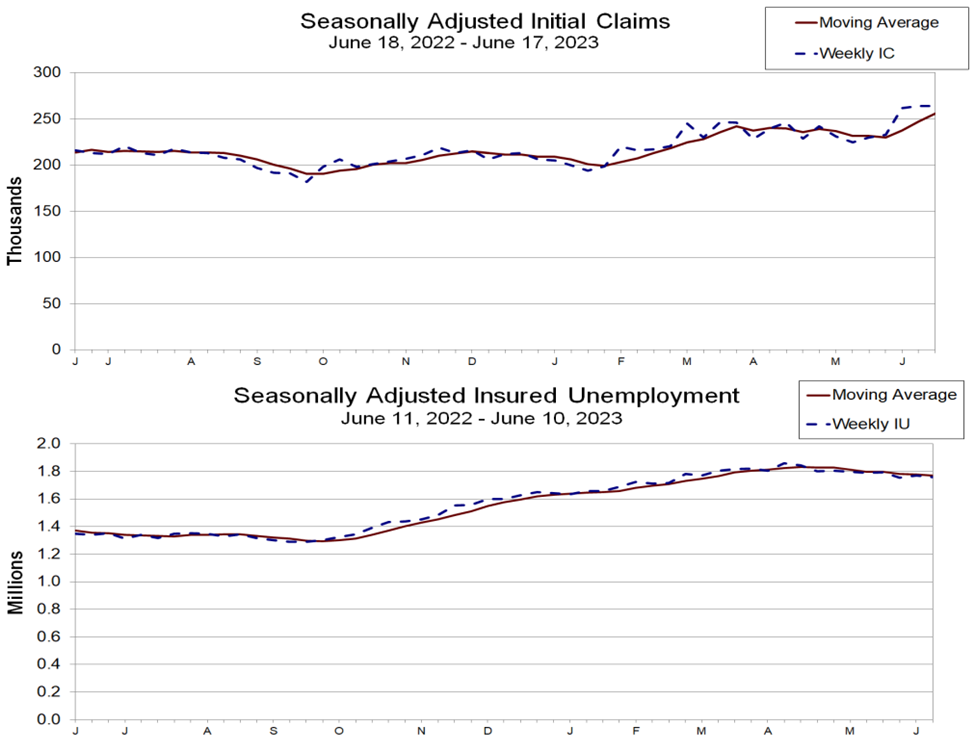
Initial jobless claims fell by 4K to 228K for the week ending August 26. The 4-week moving average increased slightly to 237,500. Continuing claims increased 28,000 to 1,725,000 from the previous week. The 4-week moving average also increased slightly to 1,704,250. The key here is that initial claims, a leading indicator, continues to represent a tight labor market which goes hand-in-hand with an economy that is clearly not in a hard landing scenario.

The Personal Consumption Expenditures price index (PCE) increased 0.2% in July. Year-over-year, the index increased from 3.0% in June to 3.3% in July. Stripping out food and energy, Core PCE ticked up 0.1 percentage points to 4.2% YoY, while MoM change was 0.2%. Personal income increased 0.2%, down from 0.3% the prior month, and personal spending climbed to 0.8%, up from 0.6% the prior month. All of these readings were basically in line with expectations. The key here is uptick in YoY inflation readings, though it wasn’t horrendous by any means, it should catch the Fed’s eye as a basis for not cutting rates any time soon.


Friday:
Stocks closed out the 1st day of September on a mixed note. The 3 main indices closed with modest gains or losses while the Russell 2000 (+1.1%) outperformed. The S&P 500 kept a position above 4,500, reaching 4,501 at its low.
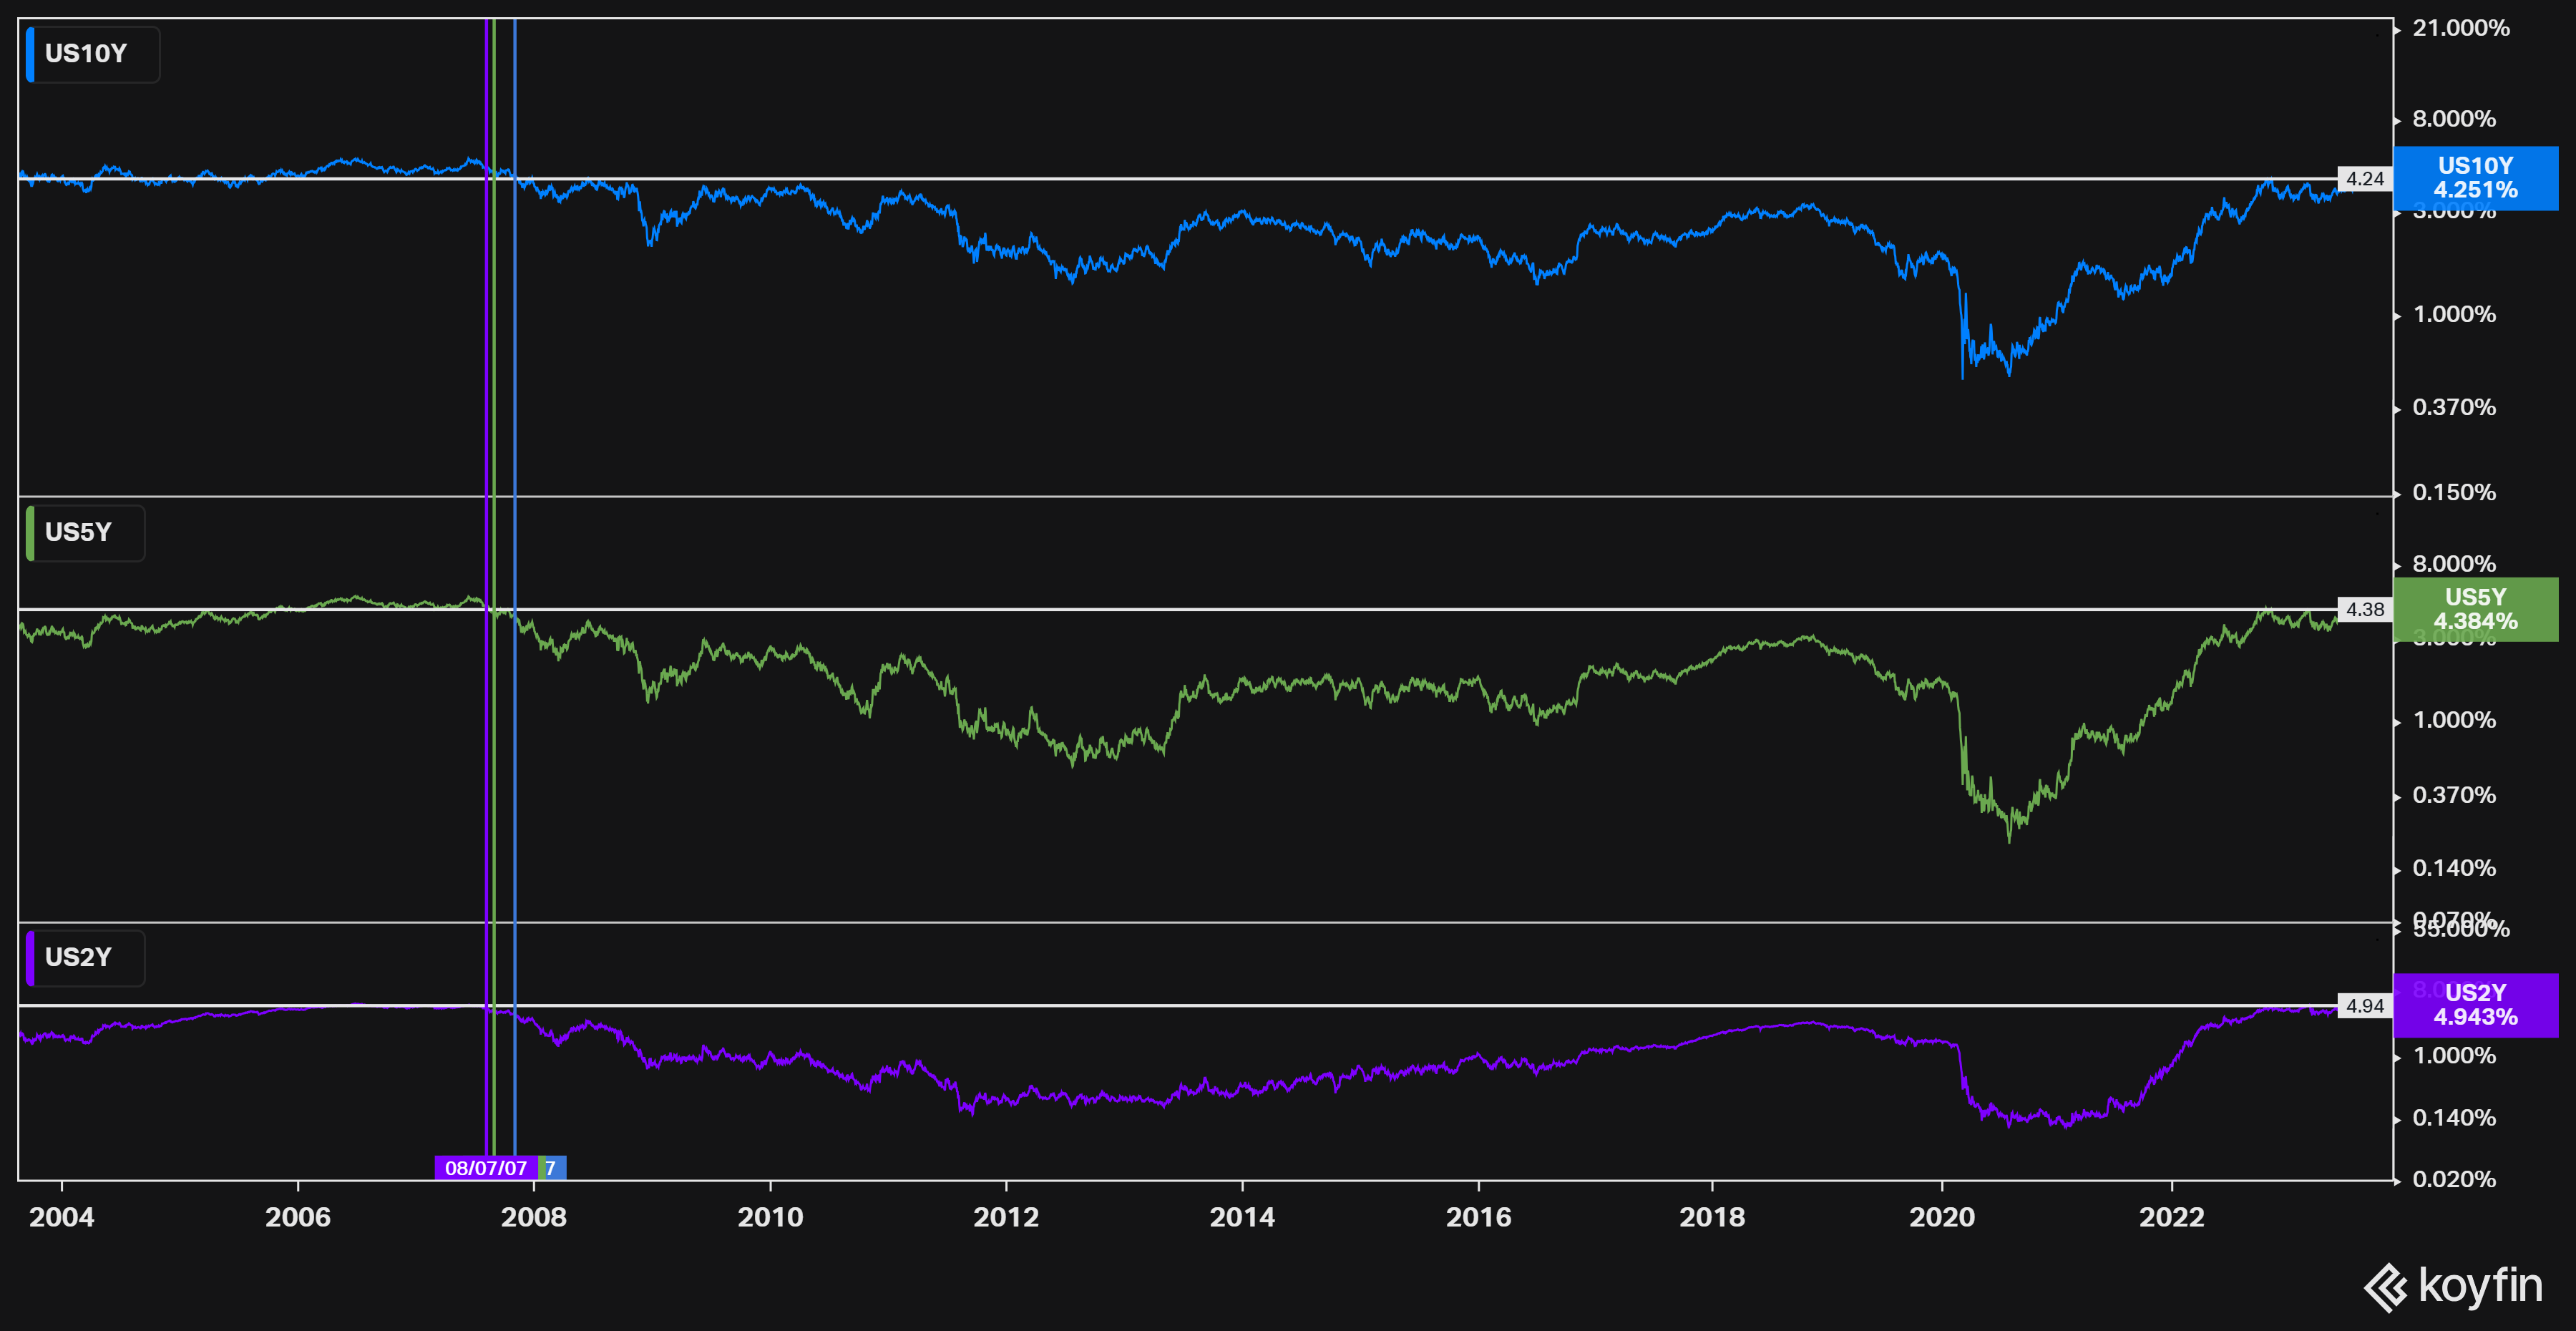
A jump in market rates and a sharp increase in oil prices acted as headwinds for the stock market. The 2-yr note yield rose 2 basis points, and fell 17 basis points this week, to 4.88%. The 10-yr note yield rose 8 basis points today, and fell 7 this week, to 4.17%.
Mega caps and growth stocks were relatively soft, reacting to the bump in rates and cooling off from a stronger showing earlier in the week. The Vanguard Mega Cap Growth closed flat while the Invesco S&P 500 Equal Weight ETF ($RSP) logged a 0.4% gain and the market-cap weighted S&P 500 rose 0.2%. The Russell 3000 Value Index rose 0.6% versus a 0.1% gain in the Russell 3000 Growth Index.
Economic data for the day included the Employment Situation report, the S&P Global US Manufacturing PMI, and the ISM Manufacturing Index.
August Nonfarm Payrolls came in at 187K, higher than the expectations and prior readings. The prior reading was revised down to 157k from 187k, a large move down. Private payrolls came in at 179k. Average hourly earnings rose 0.2%, below the expected 0.3% and prior 0.4%. The unemployment rate rose from 3.5% to 3.8%. The key takeaway here is that the moderation in hourly earnings and uptick in unemployment are both good signs that Fed won’t be raising rates again.

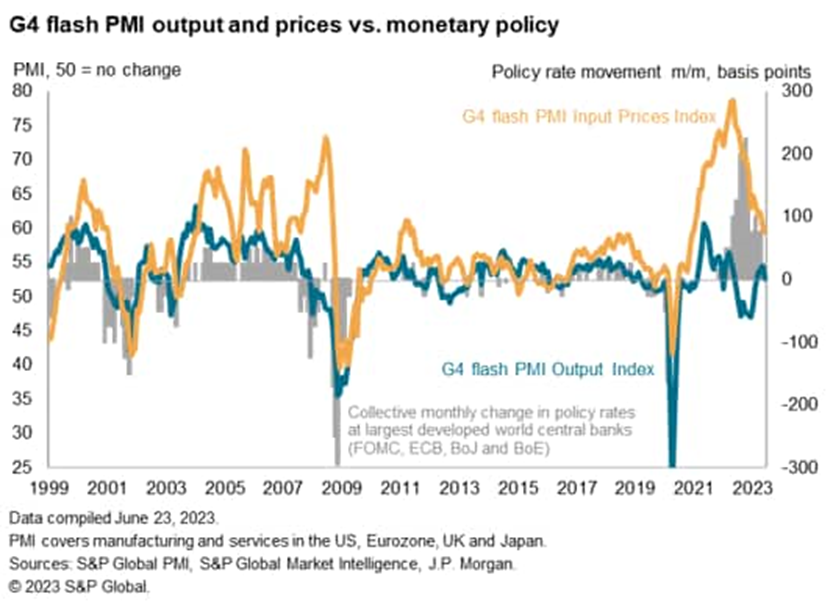
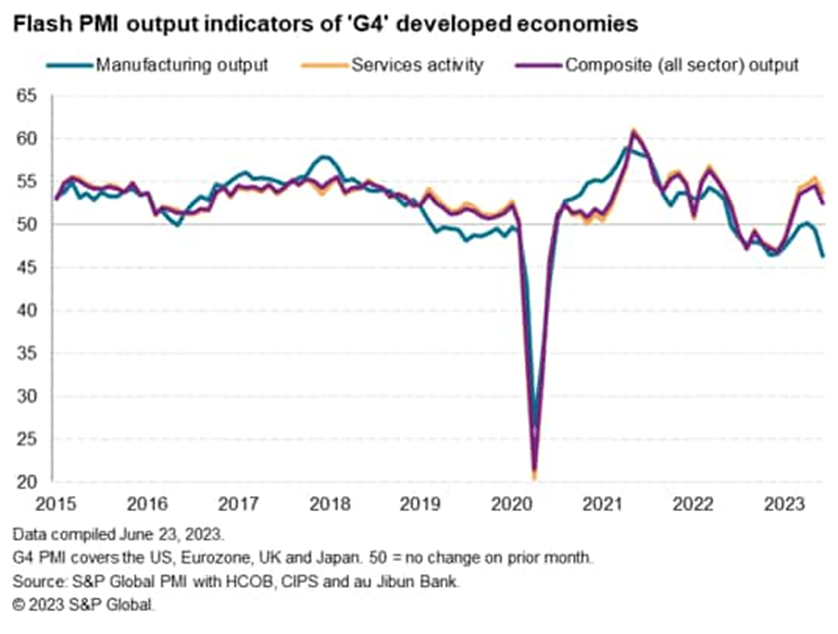
The August S&P Global US Manufacturing PMI came in at 47.9, just 0.9 higher than July. Construction Spending was 0.7%, beating 0.6% expectations. The key takeaway from the report is that residential spending continues to be powered by new single-family construction to meet demand that cannot be satisfied through the existing home market.

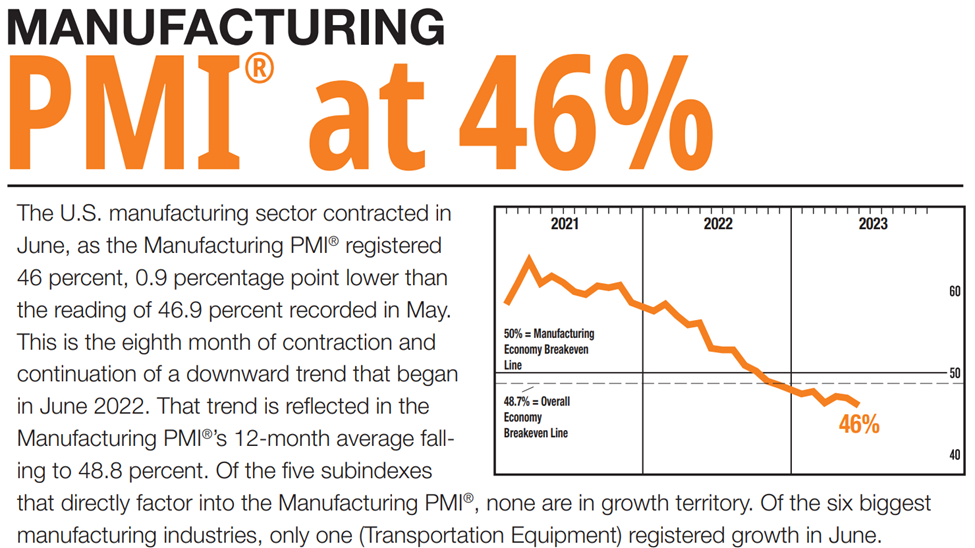
August ISM Manufacturing Index moved up to 47.6%, beating the expected 46.7% and prior 46.4%. The key takeaway from the report is that manufacturing demand remains soft (below a reading of 50 is considered contractionary, yet conditions in the manufacturing sector appear to be slowly stabilizing.

That’s it for my recap! If you would like to see how I am building my dividend portfolio using my predictions/strategy written here, you can read about my buys in my weekly portfolio update on this link.
And if you like updates like this, follow my Twitter or my CommonStock page where I post updates on the economic data throughout the week. I have also started a Twitch Channel called Games N Gains! Every Thursday at 6PM MST I go live to hang out, play games, and chat with y’all about stocks, charts, fundamentals, and anything else you like! I hope to see you there!
Regards,
Dividend Dollars