

This weekly market recap is brought to you by Koyfin, a powerful analytical tool that I am proud to partner with. Their platform is entirely customizable for whatever data you want to look at including stocks, ETFs, mutual funds, currencies, economic data releases (one of my personal favorites used often for these posts), crypto, and even transcripts of company events! Click the link above to get a special offer only for Dividend Dollar readers or go give my product review a read if you’re interested!

Dividend Dollars’ Outlook & Opinion
Last week’s call of moderately bullish to neutral was pretty spot on. The market was mostly bullish for the week, except for the steep sell-off on Thursday that nearly brought $SPY back to break even for the week.
Earnings season has reached its peak this week, with many big tech names reporting. 262 of the 500 S&P companies have reported, roughly 81% have beat EPS expectations and 58% beat sales expectations. The theme for this earnings season seems to be “better than feared” as YoY growth in earnings is down -1.8% versus an expected -6.8%. Revenues are actually 2.0% higher YoY.
This week was heavy with economic data, most of which either exceeded or were close to expectations. Initial Jobless Claims came in low, with its smallest reading since February of 2018. The first estimate for Q2 GDP came in at +2.4%, well above most estimates. The Q2 GDP price index (a figure that is similar to CPI) helped show the impact of continued inflation. Inflation is still weighing on nominal GDP growth, which came in at +4.6% QoQ, but when adjusting for inflation we end up with only +2.4% real GDP. Plus we had the Fed rate hike decision on Wednesday, which resulted in another 25 bps hike.
For the technical analysis this week, let’s remind ourselves some of what we said last week. Part of that was I wouldn’t be surprised to see a pullback at some point, and Thursday looked as if it was going to be beginning of that pullback. Technical resistance at the 4,600 level and a Treasury yield spike caused by the Bank of Japan announcing yield curve control policies, triggered the sharp fall that day. However, also like I said before, bullish momentum is strong, and we got a terrific bounce back on Friday.

The run up this week had prices get close to the top of the green ascending channel in the above chart. Thursday brought us a strong rejection, but prices recovered very well on Friday. Prior to the Thursday flush, prices pushed into 4,580 – 4,630 range that we called out last week as the next level of resistance, that range is the blue channel in the below chart. What I really like to see about this flush is the fact that prices came back down perfectly to the 0.786 fib level near 4,535 and bounced perfectly. That tells me that the support in that area has solidified and is strong, especially if it stopped a rug pull candle like Thursday.

Sentiment indicators mostly improved this week. Vix open interest change, VIX open interest put call ratio, equity volume put call ratio, and vix futures all improved to bullish/moderately bullish levels. ETF open interest changes and indices volume put call ratios both worsened to moderately bearish levels.
Overall, economic data was decent this week. The economy is still growing at a stable pace, labor markets are still strong, and consumers are still spending. The Fed has removed recessions from their forecasts. All these things, plus a decent earnings season, and a mild week for economic data next week may limit the downside risk. However, technical resistance here could prove to be strong. For that reason, I’m keeping my outlook as moderately bullish to neutral, a pullback seems less likely next week than it was this week, but I think the market still feels one creeping around the corner.
Weekly Market Review
Monday: Markets inched higher on Monday as the $DIA hit its 11th consecutive day of gains. There was low volume on the day where winners outpaced losers.
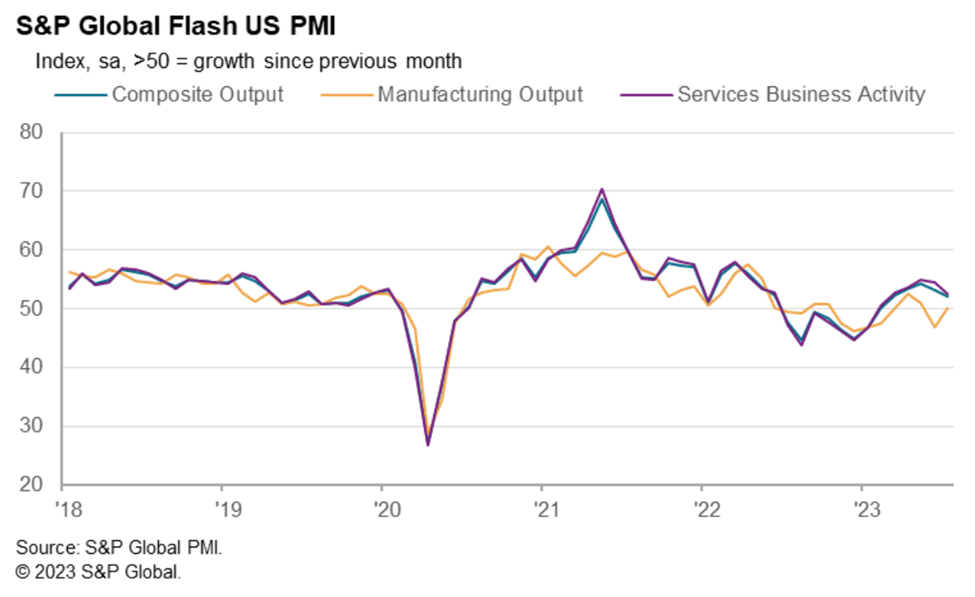
Treasuries started the day with gains after discouraging PMI readings came out of the eurozone. However, the US PMIs reading were a little better with mixed results. We showed improvements in manufacturing while services activity slowed.
Yields ended up closing near their highs for the day as investors digested an okay 2-year note auction and prepped for the $43B 5-year note auction on Tuesday. The 2-year yield rose to 4.88% and the 10-year yield rose to 3.86% on the day.
The flash July reading of the S&P CoreLogic Manufacturing PMI rose more than expected to a reading of 49.0, up from 46.3. A reading below 50 represents contraction in the sector, so we are trending in a direction that will get us out of that concerning area. The Services PMI fell to a reading of 52.4, a slightly bigger decline than expected.
Tuesday: The indices closed with gains today after the S&P 500 and the DIA hit new 52-week highs. The DJIA also hit its 12th straight day of wins. Mega cap strength helped to boost this performance.
Blue chips dominated the earnings calendar in yesterday’s after-hours and today’s early-hours. Most received positive reactions and added support for the market. $PKG, $MMM, $DOW, $GE, $NUE, and $SHW were among the standouts. The July Consumer Confidence report also added to the market support as it came in at the highest reading since July 2021.
The industrial sector was the laggard as it was heavily weighed down by $RTX, who lowered the FCF guidance for the year due to a need to inspect a portion of the PW1100G-JM engine fleet after finding a powdered metal used in production had a contaminant. In other corporate news, $UPS and the International Brotherhood of Teamsters reached a 5-year collective bargaining agreement and $BANC is in discussions to buy $PACW.
Economic data for the day included the FHFA housing price index, the S&P Case-Shiller home price index, and the Conference Board’s Consumer Confidence Index.
The FHFA index rose +0.7% MoM in May following a +0.7% increase April. The Case-Shiller 20-city composite index fell -1.7% YoY in May compared to an expected -1.9% and following a -1.7% move in April.


The consumer confidence index jumped to 117 in July, beating an expected 11.1.5 and a prior 110.1 in June. This time last year the index was at 95.3. The uptick in confidence was driven by a pickup in views about current conditions and the outlook, which are an offshoot of better feelings about inflation falling and labor market resilience.

Wednesday: Wednesday was a bit mixed as investors reacted to a heavy batch of earnings, the latest Fed meeting, and Powell’s commentary. The reaction to the 25 basis point rate hike was fairly quite as most of us looked forward to Powell’s press conference. His position was mainly one of none-commitment to any direction for the next move.
Expectations for a second hike at any of the next meetings this year did not really change. According to the CME FedWatch tool, the probability of a second hike for each of the following meetings are all under 30%.

For earnings, $GOOG and $MSFT had the largest influence as there were some mixed receptions, same with $BA, $KO, $T, and $V. The broader market held up fairly well with a 0.2% gain on the $RSP while the major indices closed closer to flat.
Economic data for the day included the MBA Mortgage Applications Index and the New Home Sales data.
Mortgage applications fell by -1.8% this week, with a surprise drop in purchase applications of -3%. Refinancing activity remained flat.

New home sales fell by -2.5% MoM in June to an annual rate of 697,000 units. This is compared to an expected 722,000 and a prior reading of 715,000 in May. On a YoY basis, new home sales were up 23.8%. New home sales activity, which is measured in signed contracts, was pressured in June by rising mortgage rates that created affordability pressures.

Thursday: Thursday started in full rally mode. $META had terrific gains after its pleasing earnings report and outlook, pushing further buying interest in mega caps.
Stocks started to roll over in the afternoon due to a number of catalysts. One was an announcement that the Bank of Japan is discussing possible changes to its yield curve control policy at their Friday meeting. This created concerns for a possible unwinding of carry trades that have been supportive of asset prices.
That news hit around the same time that the $35B 7-year note auction was met with lackluster demand. Coincidentally, the S&P 500 hit resistance at the test of the 4,600 level. This all occurred around the same time and caused a meaningful rejection as money was taken off the table.
At the NYSE, losers were beating winners by a 7-to-2 margin and a 5-to-2 margin at the Nasdaq. Then, the ECB followed the FOMC with their own 25 basis point hike. However, language on the decision drove some speculation that they may be close to done with raising rates.
Economic data for the day included the initial jobless claims report, the advanced Q2 GDP report, durable goods orders, the advanced international trade in goods report, and the pending home sales report.
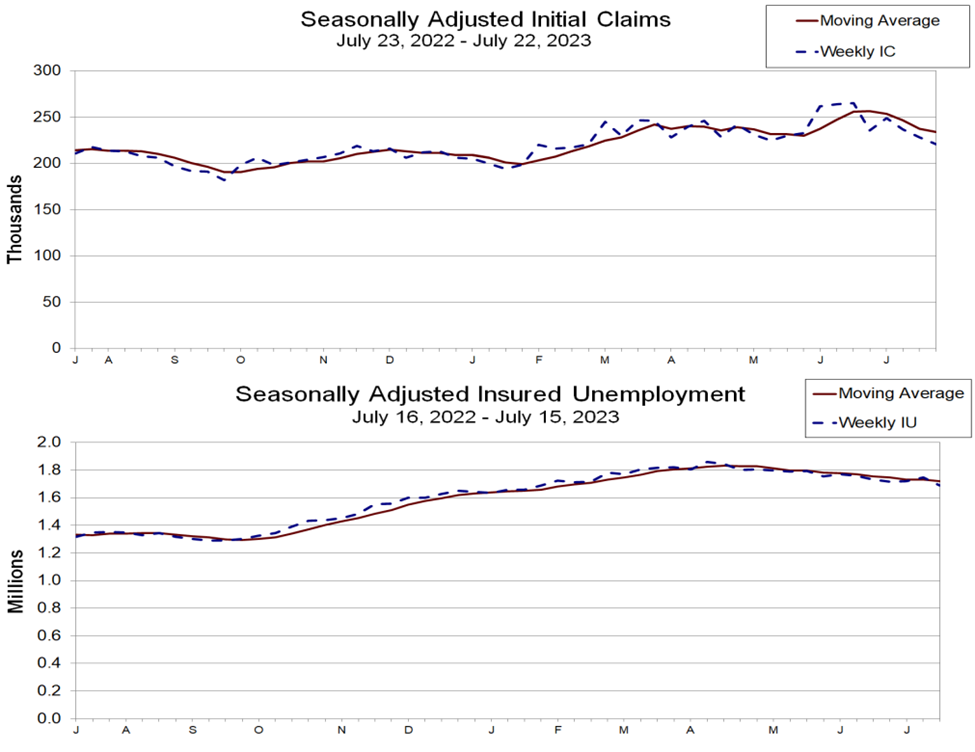
Initial jobless claims for the week of July 22nd fell by 7,000 to 221,000, better than the expected 233,000. This is the lowest level seen since February. Continuing claims for the week of July 15th fell by 59,000 to 1.69M, also the lowest level since February. The low level of initial claims, a leading indicator, reflects continued job demand strength, so much so that employers are reluctant to give up employees in a tight labor market.
The Advanced Q2 GDP report showed that real GDP grew at an annual rate of +2.4%, beating an expected +1.6% and a prior +2.0% in Q1. Consumer spending slowed to an annual rate of +1.6%, down from a +4.2% in Q1. The GDP Price Deflator dropped to +2.2% from a prior +4.1%. The economy seems to be a long way away from a recession in Q2.

June durable goods orders grew +4.7% MoM in June, compared to an expected +1.0% and a prior +2.0% in May. Excluding transportation, orders grew +0.6% MoM, beating the expected +0.2% but just short of the prior +0.7% in May. New orders were up across most durable goods categories, reflecting resilient demand for an economy that refuses to stop growing.

The June Advanced International Trade in Goods deficit narrowed to $87.1B from $91.1B. Advanced whole sale inventories fell by -0.3% and advanced retail inventories grew by +0.7%.

Pending home sales grew by +0.3% in June, the first gain since February. This figure was expected to fall by -0.5%.

Friday: The market bounced back from Thursday’s sell off, sticking to the winning play of buying weakness. Mega caps favored in that respect, hitting nice gains and propping up the indices. Many other stocks participated in the rally though.
Notable stocks that report earnings included $PG, $INTC, and $ROKU. Also, the personal income and spending report was supportive of a soft landing narrative, which was another source of support. The Bank of Japan surprised markets when it voted to manage its yield curve control policy with more flexibility, saying it will maintain a 0.5% target rate while also offering to purchase 10-year JGBs at 1%. The yen rallied on the news but lost steam as the dollar rallied back.
Economic data for the day included the Personal Income report, the Q2 Employment Cost Index, and the July University of Michigan Consumer Sentiment Index.
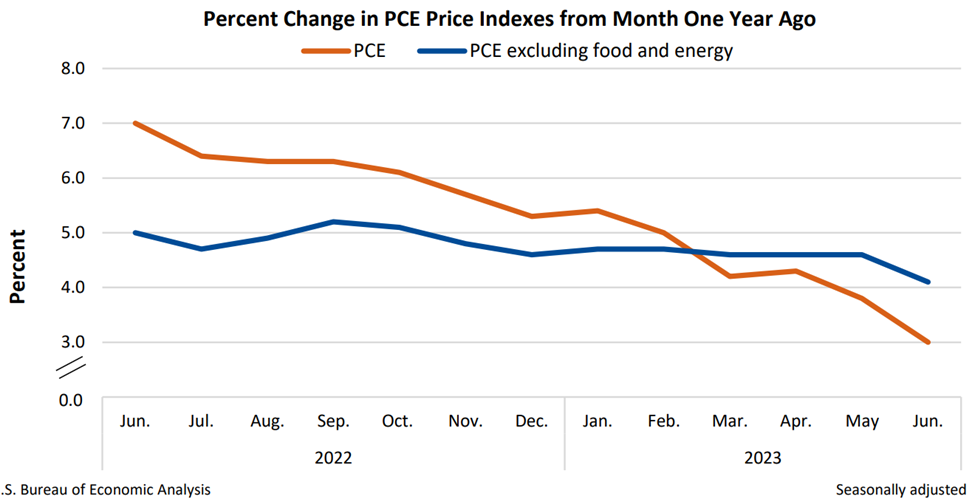
Personal incomes grew by +0.3% MoM in June, compared to an expected +0.5% and +0.5% prior reading. Personal spending grew +0.5% MoM, compared to an expected +0.3% and prior +0.2% in May. The PCE Price Index and Core PCE were both up +0.2%, in line with expectations. The takeaway form this report is a combination of solid spending and ongoing disinflation.

The Q2 employment cost index showed compensations increase by +1.0% for the three month period ending in June. This is compared to an expected +1.1% and a +1.2% prior reading for March. The key here is that we are seeing a deceleration in employment costs, which should be comforting for the market and the Fed as a reassurance that a price/wage spiral is not occurring.

The July Consumer Sentiment Index came in at 71.6, compared to an expected 72.6 and prior reading at 64.4. Last July the reading was at 51.5, putting us at a vast improvement in just a year. Outlooks have greatly improved with the slowdown in inflation and the ongoing stability of the labor market.

That’s it for my recap! If you would like to see how I am building my dividend portfolio using my predictions/strategy written here, you can read about my buys in my weekly portfolio update on this link.
And if you like updates like this, follow my Twitter or my CommonStock page where I post updates on the economic data throughout the week. I have also started a Twitch Channel called Games N Gains! Every Thursday at 6PM MST I go live to hang out, play games, and chat with y’all about stocks, charts, fundamentals, and anything else you like! I hope to see you in there!
Regards,
Dividend Dollars