Welcome back to Dividend Dollars! I hope you’re doing well and enjoying the beginning of this journey. Every week I plan on writing one of these posts to give an update on the portfolio that we are building. I will give an overview of the portfolio and its value, the dividends received, trades made, and any news or business announcements made that may be of interest to our positions. I will do my best to be consistent with these updates, but as you know, life happens to all and we may miss an update or two here or there. All that aside, lets dive in!
Portfolio Value
As this is the first installment of the portfolio update, we will use this post as a baseline to gauge progress moving forward. To date I have invested a total of $1,050 and the account is valued at $1,067.41. That’s a total gain of $17.41 for a 1.66% gain. Not a crazy gain by any means, but we are in this for the long haul. Our approach to investing in discounted stocks with growing dividends is a slow game, so this gain in the portfolio value, to me, is a huge win and tells me our strategy of trying to find discounted growth dividends stocks could be working. As we continue to invest regularly and reinvest dividends, more substantial gains will come. We are at the very beginning of the exponential curve upwards towards financial freedom.
Portfolio
Below is a table of everything we are invested in so far. The tickers in blue are the stocks that were the picks of the month. The tickers in yellow are stocks that I am just using to hold money in. Every week I add $25 to the account. I will throw that $25 at a stock that pays monthly dividends that I believe is in both a good fundamental and technical standpoint for short term gains. I leave that money in those stocks till it has compiled to an amount large enough to sell and reinvest the funds into a more expensive stock pick. That way my investments are never idle and every dollar is put to work even while it sits and waits for a stronger long term position within the portfolio.
Dividends
Last week we received $0.06 in dividends. This came from PSEC which was a stock I was using as a temporary vehicle to hold funds while I gathered more funds for a larger planned position.
Dividends received for the week of October 18th: $0.06 Dividends received for October 2021: $0.64 Year-To-Date Dividends: $0.64
Trades
At the start of the week I bought 4 shares of PSEC for $33.04 and sold them later in the week for $33.55. I bought two shares of VZ for $106.55 and 1 share of PBA for $33.88 for a temporary holding position. Earlier in the month I had added to positions in T, MMM, WBA, KO, and O, all stock picks for the month.
Noteworthy News
This section of the post will identify some headlines that may be of import to our positions. If they are important enough, we will also call out in the posts if the news calls for actions to readjust our portfolio.
Walgreens WBA to make additional investment in VillageMD: WBA popped off of this news. WBA will invest an additional $5.2 billion into the VillageMD position which is poised to open a large number of primary care practices in Walgreens stores to further progress the company’s goal of stepping into the full-service primary care practice.
AT&T Stock Below Covid Lows: I believe at less than $26 per share AT&T looks undervalued. I added to this position within the last few weeks. It seems to have found a bottom at $25 but will keep watching closely for more downsides. I will not dive into my reasoning for this opinion within this post, however I always recommend you do your own research before entering into any position.
Summary
That is it for the update this week. Let’s kill it next week and keep our eyes open for good buying opportunities. Let me know what you think of the progress so far, share with us your progress, thank you for reading, and take care!
Welcome to the first edition of Dividend Dollar’s stock picks! Here I will explain my screening process for finding high-quality dividend stocks. I will highlight which stocks are currently in my portfolio as well as my favorite picks this month that I will be looking to add. Below are my picks for this month. The tickers in blue text are stocks I already have in my portfolio. Please keep in mind that I am not a financial advisor, everything below is simply my opinion.
Ticker
AT&T (T)
Amgen (AMGN)
3M (MMM)
Walgreens Boots Alliance (WBA)
Realty Income (O)
Coca-Cola Co (KO)
Stock Screening Criteria
My stock screening criteria contains a mix of hard stats combined with a few fundamental ratios that I use as rules of thumb in order to identify stocks that reliably pay increasing dividends while also identifying if the stocks are undervalued and poised for growth. My criteria gave me a list of 15 stocks which I narrowed down to 6 based on the attractiveness of the chart and my general comfort with understanding the company. Below is a breakdown of my screening criteria, the specifics of the criteria are underlined.
Market Capitalization
Market Capitalization, also called market cap, shows us how much a company is worth as determined by the stock market. A company’s market cap is equal to the total value of a company’s outstanding shares of stock. For example, if a company has a total of 1 million shares selling for $10 each, that company’s market cap would be 10 million.
I screen for companies with a market cap of at least 10 billion. These are generally called large-cap companies. These companies are large, established, are the most common stocks to pay dividends, and are not generally at risk of going under any time soon. For a dividend portfolio, large cap stocks will be our bread and butter. These companies do not usually bring in huge gains in the short term, but in the long term they generally trend upward with consistent increases in share value and dividend payments.
I will do some experimenting with smaller companies, however, these monthly stock picks will be the majority of my portfolio and thus I will stick to screening for companies with a market cap of at least 10 billion.
Dividend Yield
The dividend yield is a financial ratio which shows how much a company pays out in dividends each year in relation to its stock price (annual dividends per share/price per share). For example, if a stock pays $5 per year and has a market price of $100, the dividend yield would be 5%.
As a dividend investor, you would think that the higher the yield the better because we want to maximize dividends. While that logic is correct, it is important to understand why certain stocks may have uncommonly high dividend yields. If a company has healthy finances, a high dividend yield may mean that the company is unnecessarily shelling out lots of money in the forms of dividends when it could be utilizing some of those funds instead to better position the company for long term success. Every dollar a company pays out as a dividend is a dollar the company is not using to generate capital gains. We want to see healthy balance of dividends and capital growth and sometimes a high dividend yield indicates the opposite.
A high dividend yield could also mean the stock’s price is declining while the dividend pay out remains the same. The stock’s price is the denominator in the equation, so if the stock is trending downwards and the dividend payout remains the same, it will inflate the yield. Take for example a stock that paid a $1 dollar dividend per share last year with a cost of $20 dollars per share. That results in a 5% dividend yield. Imagine this year that same stock still paid $1 but now the stock was worth $10. The dividend yield would now be 10%, which is an increase from last year at the expense of the stock going down 50%.
In summary, a high dividend yield is not always bad, it just calls to our attention that we should review other metrics of the stock to confirm that the company is healthy. With all of those things in mind, I screen with a dividend yield of greater than 3%. The average dividend yield of the S&P 500 is 2.22%. This criteria keeps us higher than that average while also not being too high that we have to worry about unhealthy dividend yields. We still may see some suspiciously high yields in our list, this just means we will dive into those stocks in more depth.
Consecutive Years of Dividend Growth
This criteria is fairly straight forward. Past performance isn’t always a great indicator of future performance, but in the case of dividends I don’t think this mindset is overly risky. If a dividend has increased year over year for a substantial amount of time, it is fair to expect that it will continue to do so. That is why I screen for stocks that have grown their dividends consecutively for at least 10 years.
P/E Ratio
This criteria I use as a rule of thumb and not a hard stat. P/E ratio is the price-to-earnings ratio and is calculated by market value per share divided by earnings per share. This ratio is commonly used by investors and analysts to determine if a stock is relatively undervalued and overvalued. This is where Warren Buffett found lots of success, he was great at finding companies that had discounted stock prices.
There are many complex methodologies that one can use to determine a stock’s relative value, however I believe the P/E ratio is the quickest and most straightforward way to understand a stock’s relative value. Generally, a high P/E ratio means that a stock is overvalued and a low ratio means it is undervalued.
Seems simple enough, but there are a few limitations to keep in mind. With earning per share as the denominator, if a stock has a very small earnings per share or none at all the P/E ratio won’t give you a true understanding of the stock’s relative value. P/E ratios also vary greatly from industry to industry. Therefore it is helpful to view a stocks P/E ratio year over year to see how it is trending relative to stock price. It is also helpful to understand the P/E ratio of the market or the industry a certain stock is in. This information can give you context clues to determine if a stocks P/E ratio is healthy or not.
The S&P 500 has averaged a P/E ratio of 15.95 since its inception. With the above information in mind, I like to look for P/E ratios that range from 15-30, but sometimes exceptions will be made for stocks that require further research.
D/E Ratio (TTM)
The debt to equity ratio compares a company’s total liabilities to its shareholder equity which lets us know how much leverage they are using. It measures how much debt versus equity they are using to finance their operations. In general, a high D/E ratio means higher leverage which means the company is aggressively financing its growth with debt which is risky.
If a lot of debt is used to finance the business, the cost of that debt could outweigh the benefits of the increase in earnings that it produces, however the opposite can also be true in some cases. Cost of debt can vary with market conditions and D/E ratios can vary greatly depending on industry, so it’s not always clear if a company is over leveraged or not.
In general, a high D/E ratio usually means more risk, especially with stocks that pay dividends. If a company is needing to pay down its debts, it has less cash on hand to pay dividends. My general rule of thumb for D/E trailing 12 month average is less than 15. Best case scenario, the D/E is less than 2, but some stocks will be in industries that are capital intensive which generally require more debt, so I will not immediately remove a stock from this list if they have a high D/E, these stocks will just require further research.
October Picks
Ticker
Payment Schedule
Dividend Yield
Payout Ratio
3 Year Div. Growth
Market Cap
P/E Ratio
D/E (TTM)
Average Volume
Consensus Rating
Consensus PT
Previous Close
AT&T (T)
Quarterly
7.68%
63.22%
6.12%
$191.14 B
–
1.93
37.09M
Hold
$30.78
$26.77
Amgen (AMGN)
Quarterly
3.37%
41.98%
39.13%
$118.65 B
21.26
5.64
2.62M
Hold
$245.21
$208.95
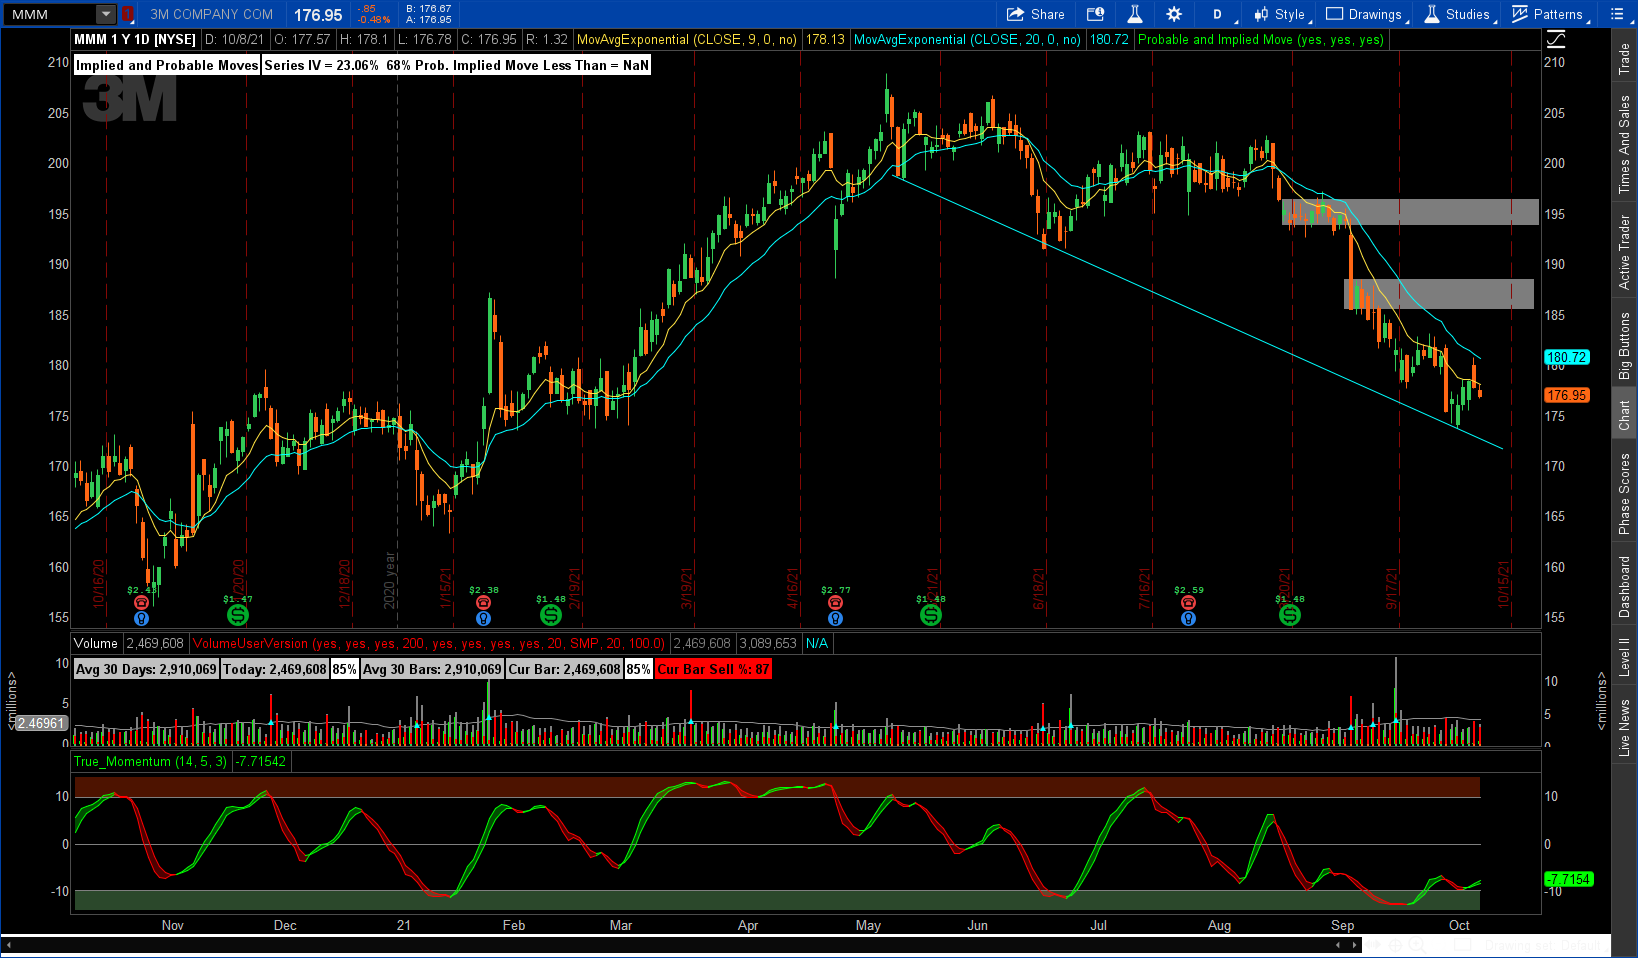
3M (MMM)
Quarterly
3.33%
59.34%
25.11%
$102.39 B
17.4
2.55
3.11M
Hold
$195.58
$176.95
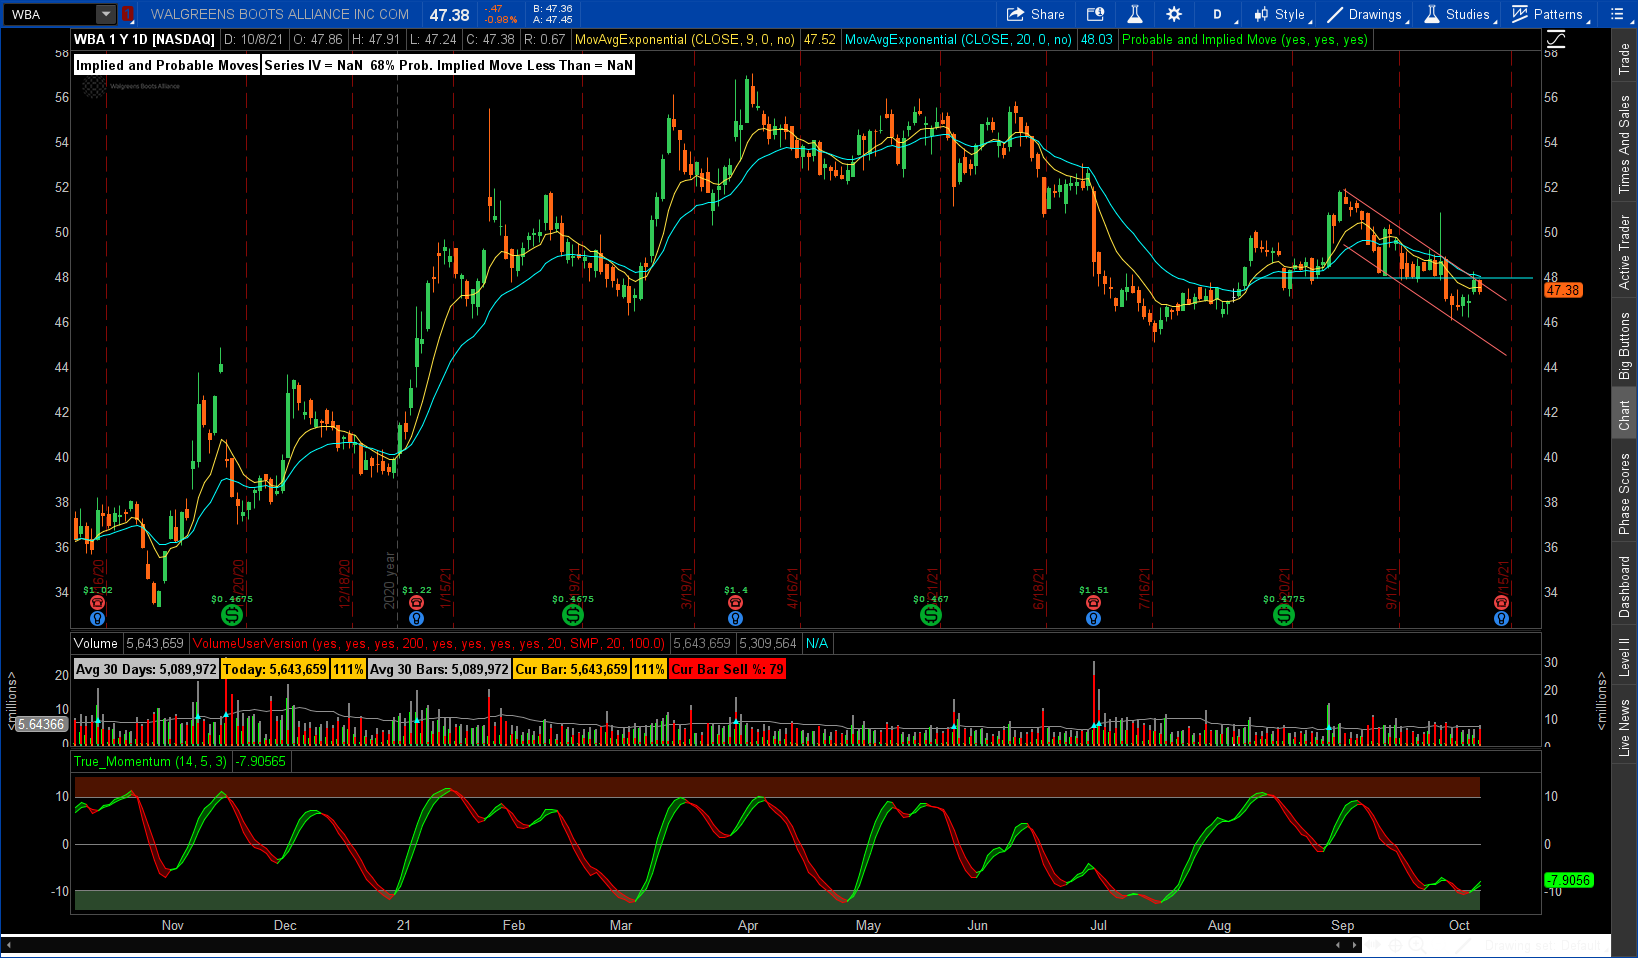
Walgreens Boots Alliance (WBA)
Quarterly
3.99%
39.58%
19.35%
$40.98 B
17.95
3.18
5.04M
Hold
$53.80
$47.38
Realty Income (O)
Monthly
4.17%
202.88%
10.41%
26.17B
67.88
0.86
4.05M
Buy
$77.14
$67.20
Coca-Cola Co (KO)
Quarterly
3.12%
73.45%
10.81%
$233.35 B
28.94
3.16
16.5M
Buy
$61.53
$54.12
All of my criteria gave me a watch list of 15 stocks. I then narrowed that list down to these 6 stocks based on attractiveness of the chart and my general comfort and understanding of the company. Above is a table of the stocks, their data that meets my screening criteria, plus some other information that is beneficial for evaluating dividend strength and good times to buy. Next lets look at each stock.
AT&T (T)
AT&T, founded in 1983 in Dallas, TX, engages in the provision of telecommunications media and technology services through their communications and WarnerMedia segments. The communications segment provides services to businesses and consumers globally. The WarnerMedia segment develops, produces, and distributes entertainment products.
AT&T has a good dividend yield and D/E ratio. They do not have a P/E which means they have little to no earnings this year. If adding AT&T to your portfolio, keep an eye on it due to the lack of a P/E ratio. AT&T’s chart is coming to a key support area in its current long term trend. I expect it to bounce, making it an attractive buy at current prices. However, there is always the possibility that it breaks support, thus it would be smart to wait for a bounce before buying.
Amgen (AMGN)
Amgen Inc. is a biotech company that engages in the discovery, development, manufacturing, and marketing of human therapeutics. Amgen has a large and diverse product line within the industry. It was founded in 1980 and is headquartered in Thousand Oaks, CA.
AMGN has a decent dividend yield and a great dividend growth rate. AMGN has the highest D/E of the picks this month, however I am not too concerned about that because that is somewhat normal for companies within their industry. AMGN’s chart shows that it is at a support area, this is the third time it has reached this level during the pandemic. If it breaks $205 it looks to be fairly bearish, but the opposite is true if it bounces on this level with upside to the $260’s. Again this is one that needs to be watched, wait for confirmation of a reversal before entering.
3M Company (MMM)
3M is a tech company which manufactures industrial, safety, and consumer products that are used in many markets including transportation, electronics, healthcare, consumer, industrial, and safety. The company was founded in 1902 and is headquartered in St. Paul, MN.
3M has a decent dividend yield, P/E, D/E, and great dividend growth. MMM has been in a down trend for the last 5 months. It had a strong week last week and the RSI shows that the downtrend is losing momentum. There is possibility for a reversal with upside to $185+.
Walgreens Boots Alliance Inc (WBA)
Walgreens is in the drug store business as most of us know. They are engaged in retail pharmacy and wholesale pharmaceuticals both in the US and internationally. Walgreens was founded in 1901 and is headquartered in Deerfield, IL.
WBA has all around decent dividend yield, P/E, and D/E. WBA’s chart has been in a short term down trend for about a month. The price is testing the upper limits of the channel as well as previous resistance. If price can break above the $48 level the stock can see some upside to $52+.
Reality Income (O)
Reality Income is a real estate company which is known for generating dependable monthly dividends. O is the only monthly dividend on our list. O was founded in 1969 and is headquartered in San Diego, CA.
O has a good yield, decent dividend growth, and a terrific D/E. O has a wild P/E ratio, however that is not uncommon for real estate stocks, so I won’t let that concern me too much. O’s chart has a wide upward trending channel that the price has been in for the last year. Last week we saw a good bounce off of the bottom trendline. RSI shows strong upward momentum with moving averages looking promising.
Coca-Cola (KO)
Coca-Cola is a nonalcoholic beverage company with a huge global presence and a large product line. The company was founded in 1886 and is headquartered in Atlanta, GA.
KO has all around decent statistics. The KO chart shows a good week as the price bounced off of a well-supported area that formed toward the beginning of April this year. It is currently in a resistance area that was formed in July. If prices break through we could see potential upside to $56+.
Conclusion
In this article I screened for stocks that look like they will provide regular growing dividends while also having potential for capital gains. My screening criteria found 15 stocks which fit the mold, I then narrowed that list down to 6 based off of the attractiveness of the stock’s chart and my comfort with understanding the company.
I am long on all of the stocks on this list. I already have positions in T, KO, AMGN, and O. I will watch this list play out through the month and will either open new positions or add to current positions at key levels if my capital allows.
I do also take into account what months these stocks pay their dividends and I try to balance my portfolio so that I am earning roughly the same amount of dividends every month. This goal may influence my timing and decisioning when it comes to purchasing some of the stocks on this list.
All 6 stocks are suitable for further research and my article is not to be taken as financial advice. Thank you for reading and feel free to leave any replies or questions you may have on here or on my socials.