Welcome back to Dividend Dollars! I hope you’re doing well and had a great week of investing. Every week I write an update on the dividend portfolio so that we can track its progress. I will give an overview of the portfolio and its value, the dividends received, trades made, and any news or business announcements made that may be of interest to our positions.
This week the market was hot! DJI set an all time high on November 3rd, SPX set an all time intraday high on November 4th, IXIC set a high on the 4th, and DJT set one on November 2nd. As you can see, all these major equities ended October strong and had a great week following it! The Feds also calmed some nerves this week with a message from the chair that reiterated that inflation is expected to be transitory and that the Fed will be patient with raising rates. While inflation remains high, job numbers are looking good and favorable seasonality looks to continue the market’s positive momentum through to the end of the year.
Overall, it was a great week. Let’s dive into the portfolio and see how we fared.
Portfolio Value
To date, I have invested $1,565 into the account, the total value of all positions plus any cash on hand is $1,596.66. That’s a gain of $31.66 for a total return of 2.02%. This is greater than the reported gain on the account of 0.57% last week!
Love seeing these gains! It tells me that our method of screening for undervalued stocks that pay strong dividends is working. As we stick with the strategy, we will start to rack up more and more dividends which will one day snowball into a great source of passive income!
Portfolio
Below is a table of everything we are invested in so far. The tickers in green are stocks that I added to this week. Every week $25 is automatically deposited into my account. When there is a stock I want to buy I’ll just throw some more funds in the account (if needed) and make the order. Sometimes I may also put that $25 towards a cheap stock that pays monthly dividends so that if I am saving to buy a larger position in something else, my cash on hand isn’t sitting idle. You will sometimes see those temporary positions in the portfolio below. We have no temporary positions for this update.
As you see with the portfolio this week, I didn’t just stick with the $25 deposit. I added $165 this week and made some nice buys! I will usually add funds to my account like this so that I can take advantage of good buying opportunities which are usually called out in my monthly stock picks or other timely articles. Stock picks for this month are LMT, CAH, and MO. I own positions in two of these and am watching MO for good opportunity to buy.
Dividends
This week we received one dividend. $0.52 from T. I own four shares of T, however, I only owned one at the time of the last ex-date (bummer).
Dividends received for the week of October 25th: $0.52
Dividends received for November 2021: $0.52
Year-To-Date Dividends: $1.16
Trades
Here’s the breakdown of the trades I made this week:
On November 2nd, I bought 1 share of CAH from the November Stock Pick Article at $49.25. I also purchased 1 share of REYN for $27.37 (REYN was a great pick, it had an 8% gain this week and we caught most of that with this add).
On November 3rd, I bought 1 share of INTC for $50.09.
On November 4th I bought 1 share of STAG for $42.51.
Noteworthy News
This section of the post will identify some headlines that may be of import to our positions. If they are important enough, we will also call out in the posts if the news calls for actions to readjust our portfolio.
Verizon and AT&T delay 5G rollout amid FAA concerns
The Federal Aviation Administration claims that 5G service could interfere with cockpit safety systems of airplanes. Verizon and AT&T claim that the FAA is just skeptical. Both companies have postponed the launch of their new 5G systems due to the concerns by about a month. Both companies are set to launch in January of 2022. This headline causeed T and VZ to drop by about 3.5% on 11/4 but they have since climbed back to prices pre-headline. Was a great quick dip to buy some if you caught it.
Summary
That is it for the update this week. Let’s kill it next week and keep our eyes open for more good buying opportunities! Let me know what you think of the progress so far, share with me your progress and questions, interact with me on twitter and Instagram using the links below!
Last month we screened for strong dividend paying stocks that are poised for growth and narrowed it down to 6 picks. I added to positions last month in all six. Here we will review how those stocks did in the month of October and how good our screener and our charting analysis was. Click here to read that article.
The stock screener gave us a list of 15 stocks which I narrowed down to 6 based off of the attractiveness of the chart and my general comfort with understanding the company. We picked AT&T (T), Amgen (AMGN), 3M (MMM), Walgreens Boots Alliance (WBA), Realty Income (O), and Coca-Cola Co (KO) for the month of October 2021.
From the date the article was published through to the end of October 2021, the picks averaged an increase of 1.08%. Realty Income (O) had the greatest increase of 6.58% and AT&T (T) had the greatest decrease of 5.64%. (Also, keep in mind I had not released my stock picks for the month until the 9th of the month, so I’m hoping with doing this for a full month now, the picks for November will have more time to play out.) Let’s review each stock and see how well our approach went.
AT&T (T)
AT&T was the big loser this month. I am down 4.25% on it. T was coming to a long-term support area around $26.75. It broke that support this month and is currently priced at $25.26. The prediction didn’t play out as planned, however if you waited for a bounce as recommended, you’d still be set up and ready to pull trigger on cheaper shares. I see another support are at $24, will watch closely to see if it holds or breaks yet again.
Amgen (AMGN)
Amgen was a small loss for me at 0.34% but could have been a 4% winner for the month if you caught the dip down to $201. AMGN was sitting at a support level for the third time since the pandemic. It dipped to just above $200 and bounced a little bit where it is still sitting at that support with a current price of $206.97. So not much has changed with the setup of this position except for the fact that it was slightly cheaper for a little bit this month. If it continues to break lower it has two support zones at just under $200 and ~$185.
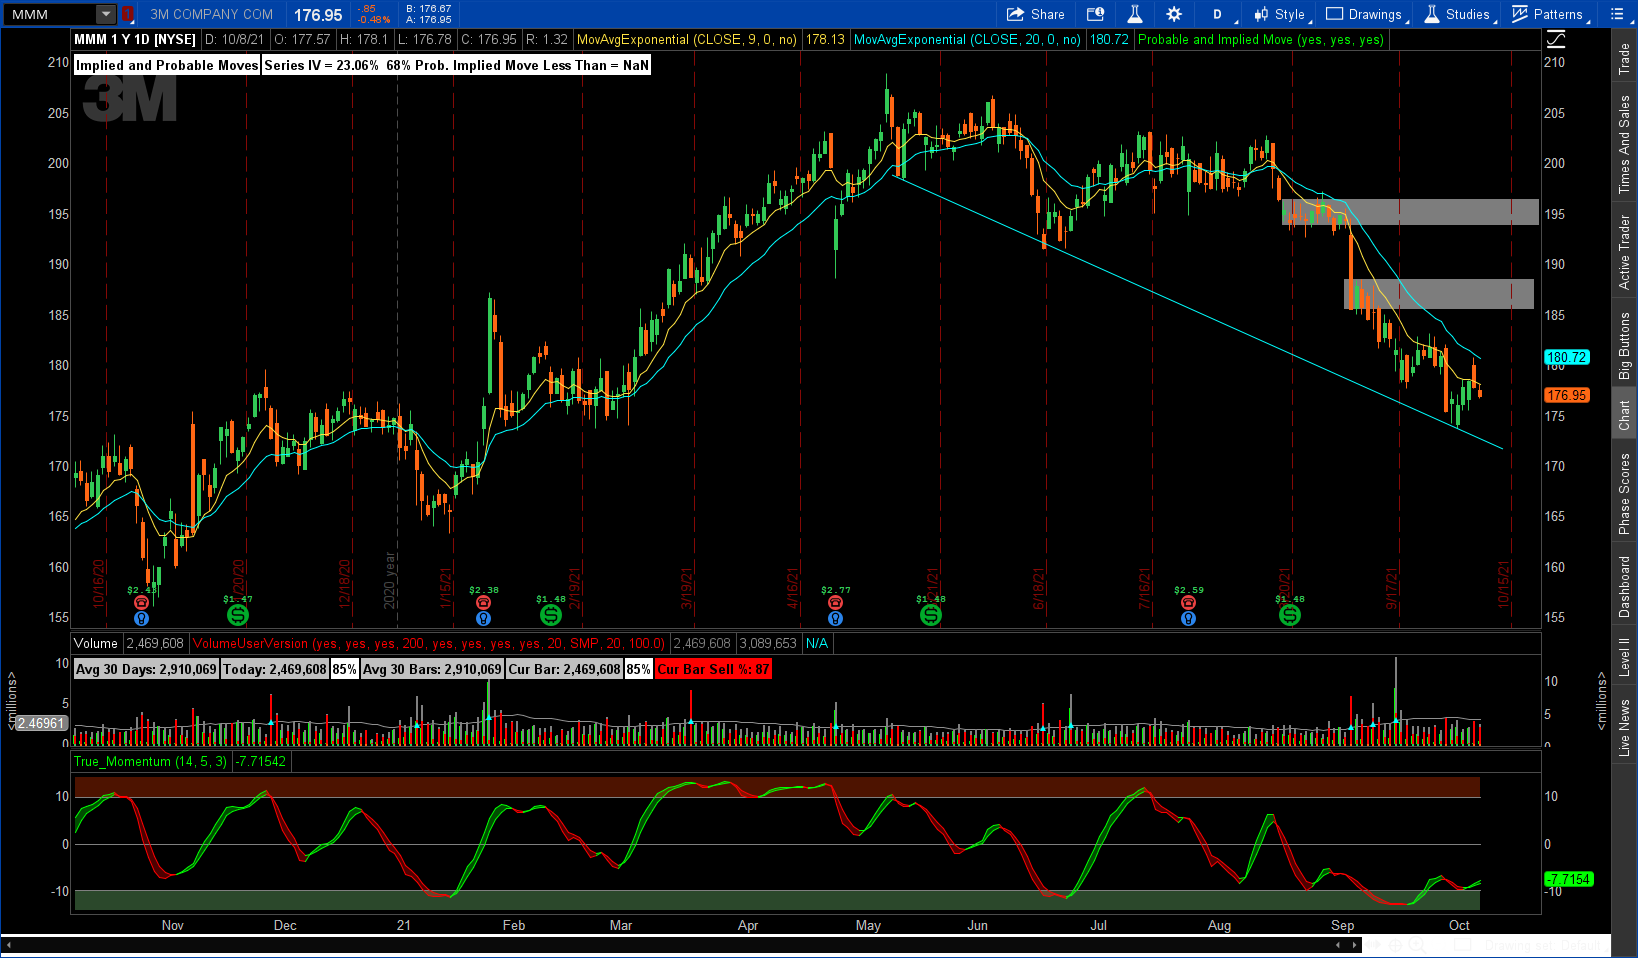
3M (MMM)
3M was a good play, but those earnings messed it up a little. I am up 0.83% on it. MMM has been in a down trend for the past 5 months. At the time of the post, it had a strong week which made it look like the downtrend was losing steam. MMM did go up a little bit, all the way to $184 before coming back down after an earnings report. Gaps up to the $185 area and then the $195 area are still possible, just waiting for confirmation if this downtrend is finished yet or not.
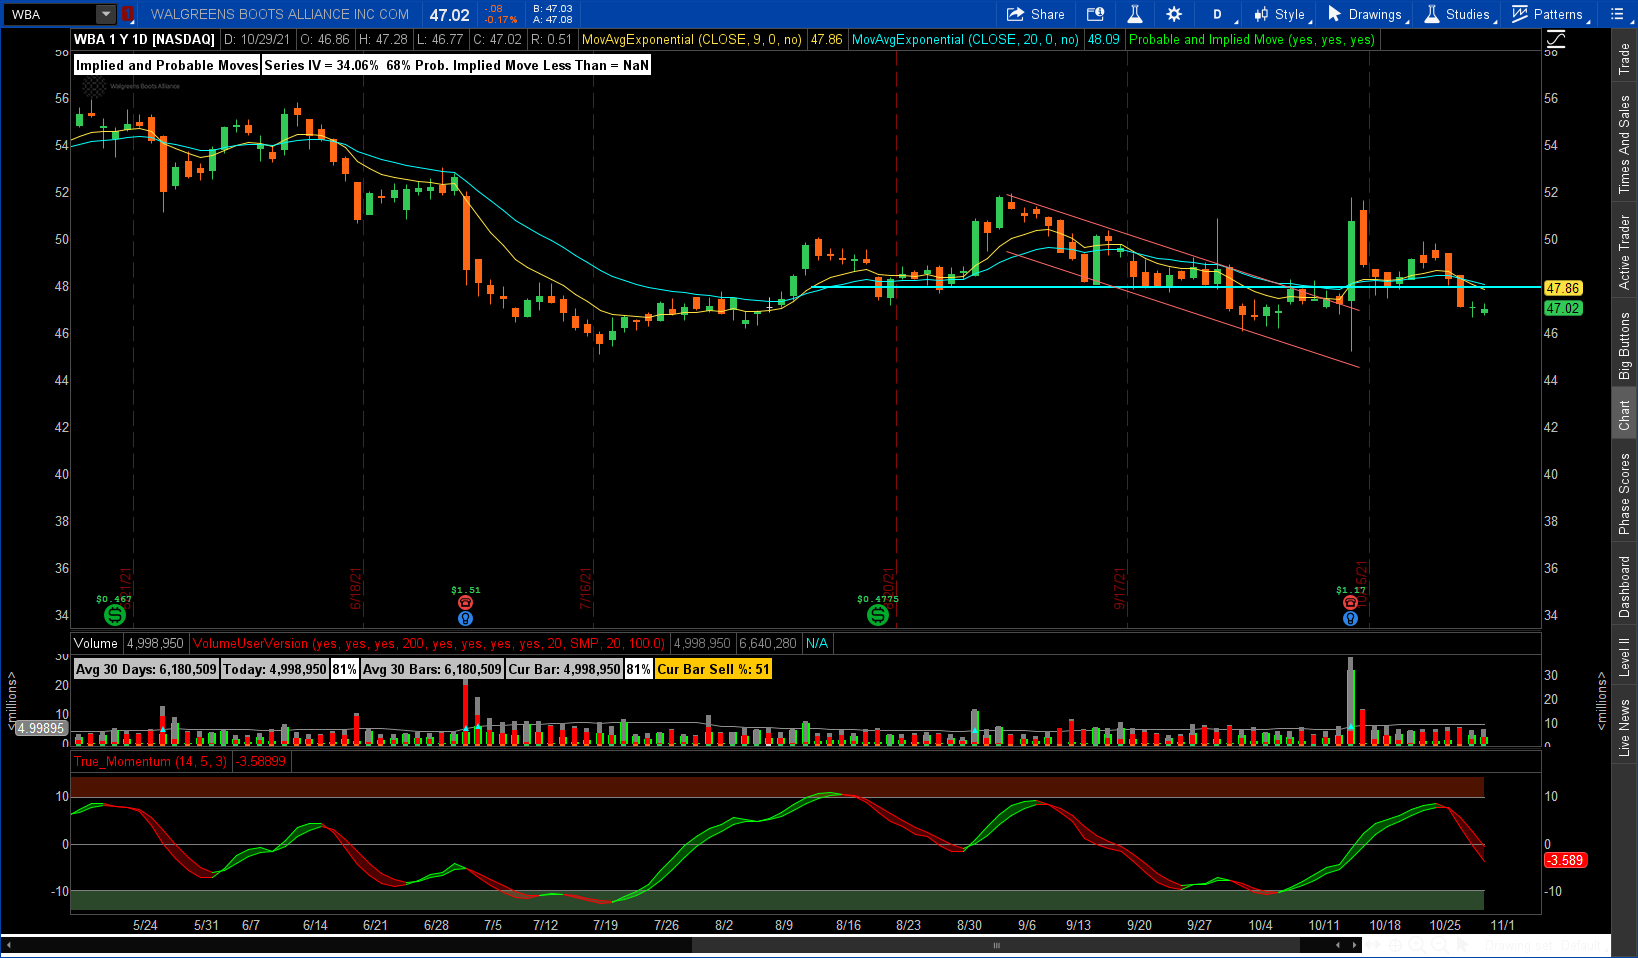
Walgreens Boots Alliance (WBA)
Walgreens was a fun one this week. I ended down 2% on it but at one point it was up 10%. WBA had been in a short term down trend for about a month. Price had pushed the upper limit of the downtrend and also was sitting on a strong support line, it looked primed for a breakout. It broke that trend with strong price movement up after a news headline on 10/14. The news, though it was good news, messed up the price action. I would have preferred the stock to make the break above naturally, but the news forced the play it didn’t have steam. It nearly hit $52 which was the upside level I had called out, but since then it has come back to its price before the breakout.
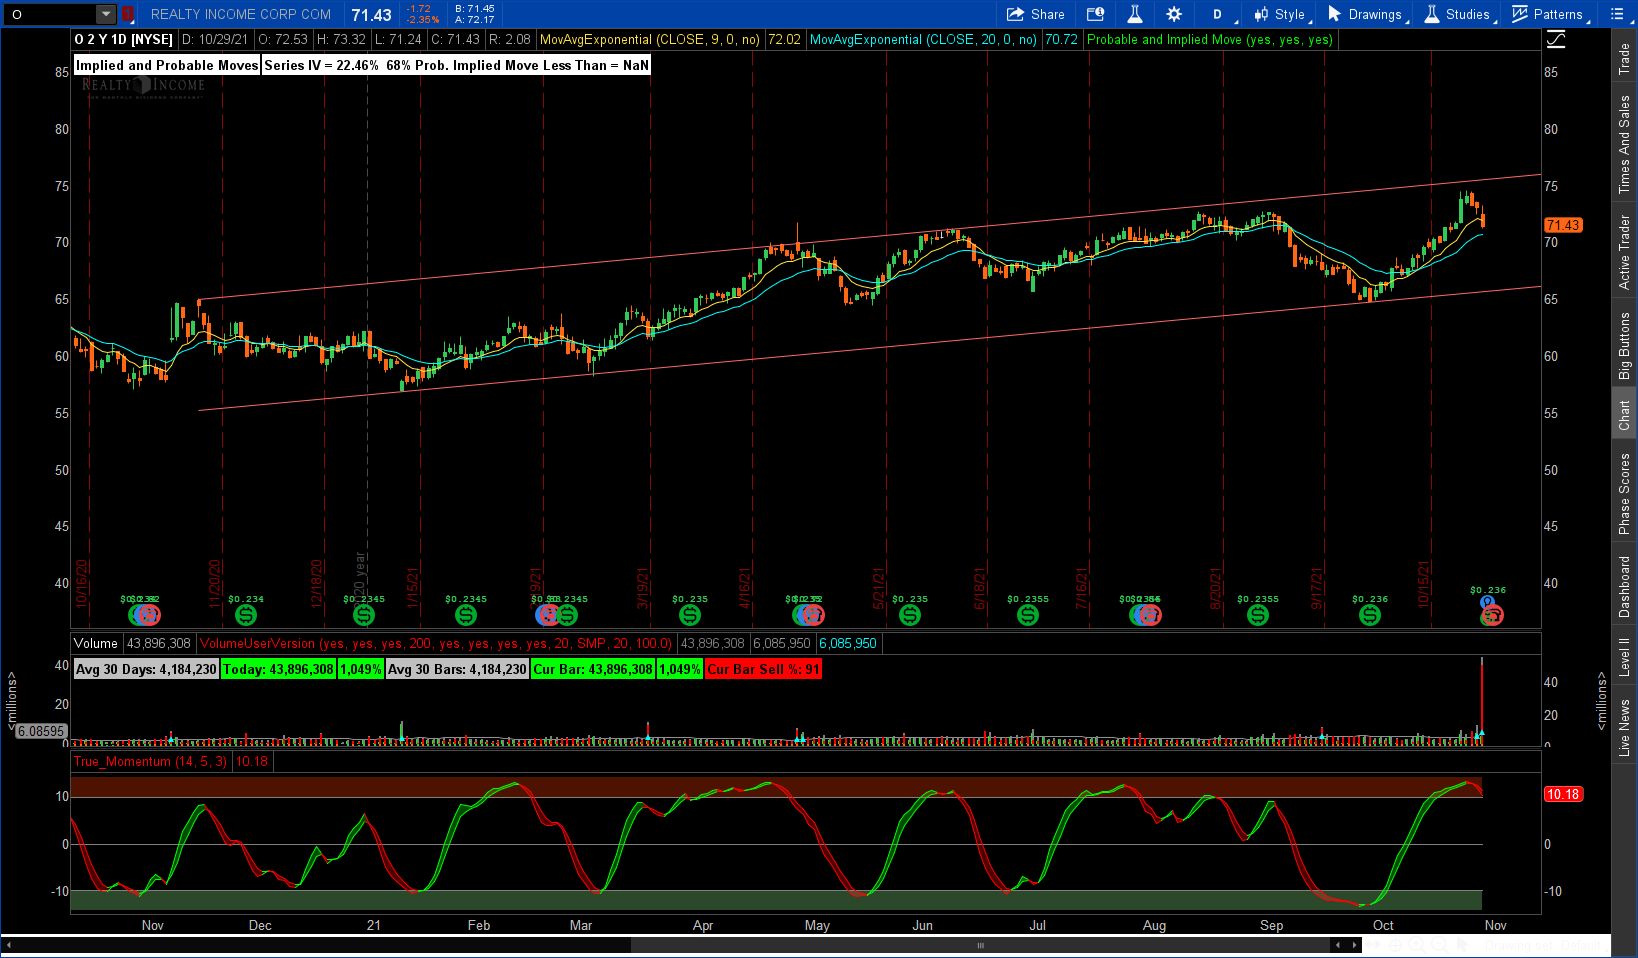
Realty Income (O)
Realty Income was the star this month with a 6.5% gain. O has stayed within a wide upward trending channel for the last year. Last month shares climbed to the top of the channel and bounced back down slightly in the last couple of days. A breakout would have been awesome, but a rejection has its benefits too. O remains strong and if it comes back down to the bottom of the channel it could be great time to pick up some more.
Coca-Cola (KO)
Coca-Cola did great with a gain of 4.2% since the post. KO broke through the resistance area around $54 and then proceeded to hit the upside that I had called out at +$56. Would love to see this strength continue to push YTD highs above $57.
That’s it for the review! I hope you enjoyed the read and the picks from last month. We are ready to do it again for November. Let’s keep catching us some good dividend growth stocks and build out our portfolio. Each stock bought is one step closer to reliable passive income!
Welcome back to Dividend Dollars! I hope you’re doing well and had a great week of investing. Every week I plan on writing one of these posts to give an update on the portfolio that we are building. I will give an overview of the portfolio and its value, the dividends received, trades made, and any news or business announcements made that may be of interest to our positions. Let’s dive in!
Portfolio Value
To date, I have invested $1,400 into the account, the total value of all positions plus any cash on hand is $1,407.95. That’s a gain of $7.95 for a 0.57% return. This is lower than the reported gain of 1.66% last week. If you want to see last week’s portfolio review click here
Gains went down but we are not discouraged! We are in the thick of earnings season which tends to lead to volatility and great buying opportunities (which we took advantage of). As we continue to invest regularly and reinvest dividends, more substantial gains will come. The path to stable and reliable passive income through dividends is a long one, but by starting and investing heavily in the early stages we are working our way up the exponential curve towards financial freedom.
Portfolio
Below is a table of everything we are invested in so far. The tickers in blue are the stocks that were the picks of the month. The tickers in green are positions we added to this week. Every week I add $25 to the account.
I will throw that $25 at a stock that pays monthly dividends that I believe is in both a good fundamental and technical standpoint for short term gains, usually those stocks will be called out in this sheet, but I sold all those temporary holding vehicles this week to free up that capital for other purchases (this is touched on again in the “Trades” section below).
I generally leave that money in those stocks till it has compiled to an amount large enough to sell and reinvest the funds into a more expensive/substantial stock pick. That way my investments are never idle, and every dollar is put to work even while it sits and waits for a stronger long term position within the portfolio.
As you see with the portfolio this week, I don’t restrict myself to only $25 per week. If there is a good buy opportunity, I will add funds to my account through my personal finances in additional to selling temporary positions to make sure I have capital to take advantage of the discount!
Dividends
We received no dividends this week, but we are set to receive a dividend from AT&T on 11/1/2021. I have four shares of T, but at the ex-date I only had one, so it is just the one dividend for me next week.
Dividends received for the week of October 25th: $0
Dividends received for October 2021: $0.64
Year-To-Date Dividends: $0.64
Trades
Here’s the breakdown of the trades I made this week:
On the 25th, I bought two shares of WSR at $9.88 to use as a temporary position to hold capital.
On the 26th, LMT dipped by 8% after Q3 earnings report was released which I saw as a great buying opportunity (to read more about why I think LMT is good, continue to the “Noteworthy News” section below). In order to buy LMT at $327.61, I sold my temporary holding positions of PBA and SJR for a small loss of $0.88 and deposited funds into my account.
On the 27th, AQN dipped nearly 5% following news I bought one at $14.50.
On the 28th, I also bought INTC for $47.96.
On the 29th, I sold temporary holding positions in WSR and SLG for a total loss of $3.00 in order to have capital for a purchase of O at $72.25 and a purchase of AQN at 14.66.
I sold all my temporary positions in order to buy other substantial positions. Each time I did that I took a small loss and never held long enough to even be rewarded with a dividend. I’m beginning to think that strategy isn’t a constructive one and will trade differently next week.
Noteworthy News
This section of the post will identify some headlines that may be of import to our positions. If they are important enough, we will also call out in the posts if the news calls for actions to readjust our portfolio.
LMT Q3 2021 Earnings
On Tuesday, LMT shares went down nearly 12% following the release of their Q3 quarterly earnings report. Within the report, Lockheed’s sales and revenues fell and the company stated that they would be reassessing their 5-year plan. Earnings were low this quarter following a $1.7 billion pension settlement. Regardless of that bad news, Lockheed reflects strong cash flow generation with a slight reduction in revenue for the next year. Not great news, but also not worthy of a 12% drop! I took advantage of this drop. LMT will be a long-term hold for me. They have a good dividend yield and as the national supply chain heals their business should improve.
INTC Q3 2021 Earnings
Last week, on 10/21/2021, Intel released their Q3 earnings and it was not received well. The stock dropped nearly 15% at the lowest price this week. I wrote an article here, click to read more. The summary of the article is that I believe INTC’s recent drop was an overreaction which has provided us with another good buying opportunity. Intel’s financials are healthy and they are poised for success in a fast-growing high-demand market.
AQN Acquiring Kentucky Power Company
American Electric Power entered into an agreement to sell their Kentucky operations Kentucky Power Company to Liberty, the utility business of parent company Algonquin Power & Utilities Corp. for $2.846 billion enterprise value. The sale is expected to close Q2 of 2022. AQN provides electricity, natural gas, water, and wastewater services to 13 US states and Canada. AQN will be purchasing all the stock of Kentucky Power at $18.15 per share. This purchase will significantly grow AQNs electric utility operations and will contribute to growing their net earnings per share over the long-term. To me, that deal sounds great and provided a great buying opportunity to add some cheap energy shares to the portfolio.
Summary
That is it for the update this week. Let’s kill it next week and keep our eyes open for more good buying opportunities! Let me know what you think of the progress so far, share with me your progress and questions, interact with me on twitter and Instagram using the links below!
Welcome back to Dividend Dollars. In this post we will discuss Intel (INTC) and how it is potentially undervalued and currently presents a good buying opportunity. Spoiler alert: I bought INTC today.
Intel Overview
Intel is an American (headquartered in Santa Clara, CA) multinational corporation and tech company. They are a HUGE semiconductor chip manufacturer and is the developer of one of the most popular lines of computer processors on the market. Their microprocessors are supplied to computer companies such as Dell, HP, and Lenovo (I’m writing on a Lenovo right now, great computer). Intel also produces motherboard chipsets, graphics cards, and nearly any other device you can think of related to communications and computing. In 2020, they had a net income of $20.9 billion dollars.
Q3 2021 Earnings Overview
Intel released their Q3 2021 earnings on 10-21-2021 and it was not received well by the market. Share price has dropped by nearly 15% at the lowest since the earning report was released. Current INTC price is $48.18 down from $56 prior to the earnings. Following the earnings, a handful of analysts downgraded their ratings on the stock.
In the earnings report, earnings per share increased by 58% from what it was a year ago, and it increased by 34% from last quarter. These earnings were ahead of most estimates. INTC reported a revenue of $18.1 billion which was 1% below market consensus but above the prior quarter. Overall, the earnings show they are a cash cow with a good and healthy balance sheet but the market seemed to react more strongly to the bad sentiment surrounding Intel and their operations. INTC continues to be plagued by a broken supply chain which is hampering sales and the semiconductor industry continues to get more and more competitive as key players improve and introduce new chips. INTC is moving in the correct direction to combat this. They announced earlier this year that they will be investing $20 billion dollars to build two new chip plants in Arizona which will help with these manufacturing/supply chain issues in the future. This quarter’s earning report shows that they have more than enough cash on hand to handle this investment while continuing to pay healthy dividends.
My Response to the Report
In my opinion, a 15% drop on these earnings is an overreaction which provides us with a good opportunity to buy. We love the discount! INTC, unlike IBM or other legacy tech companies, is not slowing down and the quarterly earnings show this. INTC’s dividends are well covered by their revenue which is poised for growth.
Now let’s dive into INTC’s stats as I like to do with my monthly stock picks. If you haven’t read one of those yet, please do so with this link, it explains my stock pick criteria in case you need to understand the reasoning and jargon here. INTC has a P/E ratio of 9.3 (this is slightly lower than the P/E ratio range I like to see), they have a payout ratio of 26.64%, they have 7 years of consecutive dividend growth (a little shorter than the 10 years I like), a dividend yield of 2.89% (close to the 3% I like to see), and a great D/E ratio of 4.3. While these stats don’t quite meet up with my stock pick criteria, I still really like the outlook of Intel and their attractive dividend.
In addition to all this good news and stats, there was a decent chunk of insider buying from INTC executives recently. Intel’s CEO and four members of the board of directors bought about $2.5 million dollars’ worth of shares on 10/25. That is the largest number shares bought by insiders in a single day since March of 2020. Funny enough, at the time of the previous large insider purchases INTC was near $46 a share, not too far from where it is now.
The Chart
INTC’s chart also looks good. The past 4 years has built a solid support level around the $45 mark. We could see shares drop to that level and below to $43, but I wouldn’t be surprised if it bounces sooner. Time and time again, INTC has bounced as it touches the lower keltner channel and it is touching it right now. The keltner channel support in addition to its approach to the support level at $45 makes me confident in a bounce.
Summary
I believe INTC’s recent drop in pricing following their Q3 2021 report was an overreaction in the market. But that overreaction has provided us with a great opportunity to buy some discounted shares. INTC may be behind the curve relative to other comparable chip companies, but Intel is poised for success with a wide line of products in a fast-growing market that has a desperate need for expansion in order to accommodate industry demand. Intel is taking steps to meet that demand, their financials remain strong, their dividends are healthy, and insiders are showing their support with their wallets.
So, how do you catch a falling knife like INTC? With a steel glove. I picked up INTC at $47.96 and plan to hold for the long term and rake in those dividends! INTC, as of today, pays $0.3475 per share every quarter. The Ex-Date for the next dividend is 11/04/2021.
As always, do your own research, leave comments, ask questions below, and thank you for reading!
Welcome to the first edition of Dividend Dollar’s stock picks! Here I will explain my screening process for finding high-quality dividend stocks. I will highlight which stocks are currently in my portfolio as well as my favorite picks this month that I will be looking to add. Below are my picks for this month. The tickers in blue text are stocks I already have in my portfolio. Please keep in mind that I am not a financial advisor, everything below is simply my opinion.
Ticker
AT&T (T)
Amgen (AMGN)
3M (MMM)
Walgreens Boots Alliance (WBA)
Realty Income (O)
Coca-Cola Co (KO)
Stock Screening Criteria
My stock screening criteria contains a mix of hard stats combined with a few fundamental ratios that I use as rules of thumb in order to identify stocks that reliably pay increasing dividends while also identifying if the stocks are undervalued and poised for growth. My criteria gave me a list of 15 stocks which I narrowed down to 6 based on the attractiveness of the chart and my general comfort with understanding the company. Below is a breakdown of my screening criteria, the specifics of the criteria are underlined.
Market Capitalization
Market Capitalization, also called market cap, shows us how much a company is worth as determined by the stock market. A company’s market cap is equal to the total value of a company’s outstanding shares of stock. For example, if a company has a total of 1 million shares selling for $10 each, that company’s market cap would be 10 million.
I screen for companies with a market cap of at least 10 billion. These are generally called large-cap companies. These companies are large, established, are the most common stocks to pay dividends, and are not generally at risk of going under any time soon. For a dividend portfolio, large cap stocks will be our bread and butter. These companies do not usually bring in huge gains in the short term, but in the long term they generally trend upward with consistent increases in share value and dividend payments.
I will do some experimenting with smaller companies, however, these monthly stock picks will be the majority of my portfolio and thus I will stick to screening for companies with a market cap of at least 10 billion.
Dividend Yield
The dividend yield is a financial ratio which shows how much a company pays out in dividends each year in relation to its stock price (annual dividends per share/price per share). For example, if a stock pays $5 per year and has a market price of $100, the dividend yield would be 5%.
As a dividend investor, you would think that the higher the yield the better because we want to maximize dividends. While that logic is correct, it is important to understand why certain stocks may have uncommonly high dividend yields. If a company has healthy finances, a high dividend yield may mean that the company is unnecessarily shelling out lots of money in the forms of dividends when it could be utilizing some of those funds instead to better position the company for long term success. Every dollar a company pays out as a dividend is a dollar the company is not using to generate capital gains. We want to see healthy balance of dividends and capital growth and sometimes a high dividend yield indicates the opposite.
A high dividend yield could also mean the stock’s price is declining while the dividend pay out remains the same. The stock’s price is the denominator in the equation, so if the stock is trending downwards and the dividend payout remains the same, it will inflate the yield. Take for example a stock that paid a $1 dollar dividend per share last year with a cost of $20 dollars per share. That results in a 5% dividend yield. Imagine this year that same stock still paid $1 but now the stock was worth $10. The dividend yield would now be 10%, which is an increase from last year at the expense of the stock going down 50%.
In summary, a high dividend yield is not always bad, it just calls to our attention that we should review other metrics of the stock to confirm that the company is healthy. With all of those things in mind, I screen with a dividend yield of greater than 3%. The average dividend yield of the S&P 500 is 2.22%. This criteria keeps us higher than that average while also not being too high that we have to worry about unhealthy dividend yields. We still may see some suspiciously high yields in our list, this just means we will dive into those stocks in more depth.
Consecutive Years of Dividend Growth
This criteria is fairly straight forward. Past performance isn’t always a great indicator of future performance, but in the case of dividends I don’t think this mindset is overly risky. If a dividend has increased year over year for a substantial amount of time, it is fair to expect that it will continue to do so. That is why I screen for stocks that have grown their dividends consecutively for at least 10 years.
P/E Ratio
This criteria I use as a rule of thumb and not a hard stat. P/E ratio is the price-to-earnings ratio and is calculated by market value per share divided by earnings per share. This ratio is commonly used by investors and analysts to determine if a stock is relatively undervalued and overvalued. This is where Warren Buffett found lots of success, he was great at finding companies that had discounted stock prices.
There are many complex methodologies that one can use to determine a stock’s relative value, however I believe the P/E ratio is the quickest and most straightforward way to understand a stock’s relative value. Generally, a high P/E ratio means that a stock is overvalued and a low ratio means it is undervalued.
Seems simple enough, but there are a few limitations to keep in mind. With earning per share as the denominator, if a stock has a very small earnings per share or none at all the P/E ratio won’t give you a true understanding of the stock’s relative value. P/E ratios also vary greatly from industry to industry. Therefore it is helpful to view a stocks P/E ratio year over year to see how it is trending relative to stock price. It is also helpful to understand the P/E ratio of the market or the industry a certain stock is in. This information can give you context clues to determine if a stocks P/E ratio is healthy or not.
The S&P 500 has averaged a P/E ratio of 15.95 since its inception. With the above information in mind, I like to look for P/E ratios that range from 15-30, but sometimes exceptions will be made for stocks that require further research.
D/E Ratio (TTM)
The debt to equity ratio compares a company’s total liabilities to its shareholder equity which lets us know how much leverage they are using. It measures how much debt versus equity they are using to finance their operations. In general, a high D/E ratio means higher leverage which means the company is aggressively financing its growth with debt which is risky.
If a lot of debt is used to finance the business, the cost of that debt could outweigh the benefits of the increase in earnings that it produces, however the opposite can also be true in some cases. Cost of debt can vary with market conditions and D/E ratios can vary greatly depending on industry, so it’s not always clear if a company is over leveraged or not.
In general, a high D/E ratio usually means more risk, especially with stocks that pay dividends. If a company is needing to pay down its debts, it has less cash on hand to pay dividends. My general rule of thumb for D/E trailing 12 month average is less than 15. Best case scenario, the D/E is less than 2, but some stocks will be in industries that are capital intensive which generally require more debt, so I will not immediately remove a stock from this list if they have a high D/E, these stocks will just require further research.
October Picks
Ticker
Payment Schedule
Dividend Yield
Payout Ratio
3 Year Div. Growth
Market Cap
P/E Ratio
D/E (TTM)
Average Volume
Consensus Rating
Consensus PT
Previous Close
AT&T (T)
Quarterly
7.68%
63.22%
6.12%
$191.14 B
–
1.93
37.09M
Hold
$30.78
$26.77
Amgen (AMGN)
Quarterly
3.37%
41.98%
39.13%
$118.65 B
21.26
5.64
2.62M
Hold
$245.21
$208.95
3M (MMM)
Quarterly
3.33%
59.34%
25.11%
$102.39 B
17.4
2.55
3.11M
Hold
$195.58
$176.95
Walgreens Boots Alliance (WBA)
Quarterly
3.99%
39.58%
19.35%
$40.98 B
17.95
3.18
5.04M
Hold
$53.80
$47.38
Realty Income (O)
Monthly
4.17%
202.88%
10.41%
26.17B
67.88
0.86
4.05M
Buy
$77.14
$67.20
Coca-Cola Co (KO)
Quarterly
3.12%
73.45%
10.81%
$233.35 B
28.94
3.16
16.5M
Buy
$61.53
$54.12
All of my criteria gave me a watch list of 15 stocks. I then narrowed that list down to these 6 stocks based on attractiveness of the chart and my general comfort and understanding of the company. Above is a table of the stocks, their data that meets my screening criteria, plus some other information that is beneficial for evaluating dividend strength and good times to buy. Next lets look at each stock.
AT&T (T)
AT&T, founded in 1983 in Dallas, TX, engages in the provision of telecommunications media and technology services through their communications and WarnerMedia segments. The communications segment provides services to businesses and consumers globally. The WarnerMedia segment develops, produces, and distributes entertainment products.
AT&T has a good dividend yield and D/E ratio. They do not have a P/E which means they have little to no earnings this year. If adding AT&T to your portfolio, keep an eye on it due to the lack of a P/E ratio. AT&T’s chart is coming to a key support area in its current long term trend. I expect it to bounce, making it an attractive buy at current prices. However, there is always the possibility that it breaks support, thus it would be smart to wait for a bounce before buying.
Amgen (AMGN)
Amgen Inc. is a biotech company that engages in the discovery, development, manufacturing, and marketing of human therapeutics. Amgen has a large and diverse product line within the industry. It was founded in 1980 and is headquartered in Thousand Oaks, CA.
AMGN has a decent dividend yield and a great dividend growth rate. AMGN has the highest D/E of the picks this month, however I am not too concerned about that because that is somewhat normal for companies within their industry. AMGN’s chart shows that it is at a support area, this is the third time it has reached this level during the pandemic. If it breaks $205 it looks to be fairly bearish, but the opposite is true if it bounces on this level with upside to the $260’s. Again this is one that needs to be watched, wait for confirmation of a reversal before entering.
3M Company (MMM)
3M is a tech company which manufactures industrial, safety, and consumer products that are used in many markets including transportation, electronics, healthcare, consumer, industrial, and safety. The company was founded in 1902 and is headquartered in St. Paul, MN.
3M has a decent dividend yield, P/E, D/E, and great dividend growth. MMM has been in a down trend for the last 5 months. It had a strong week last week and the RSI shows that the downtrend is losing momentum. There is possibility for a reversal with upside to $185+.
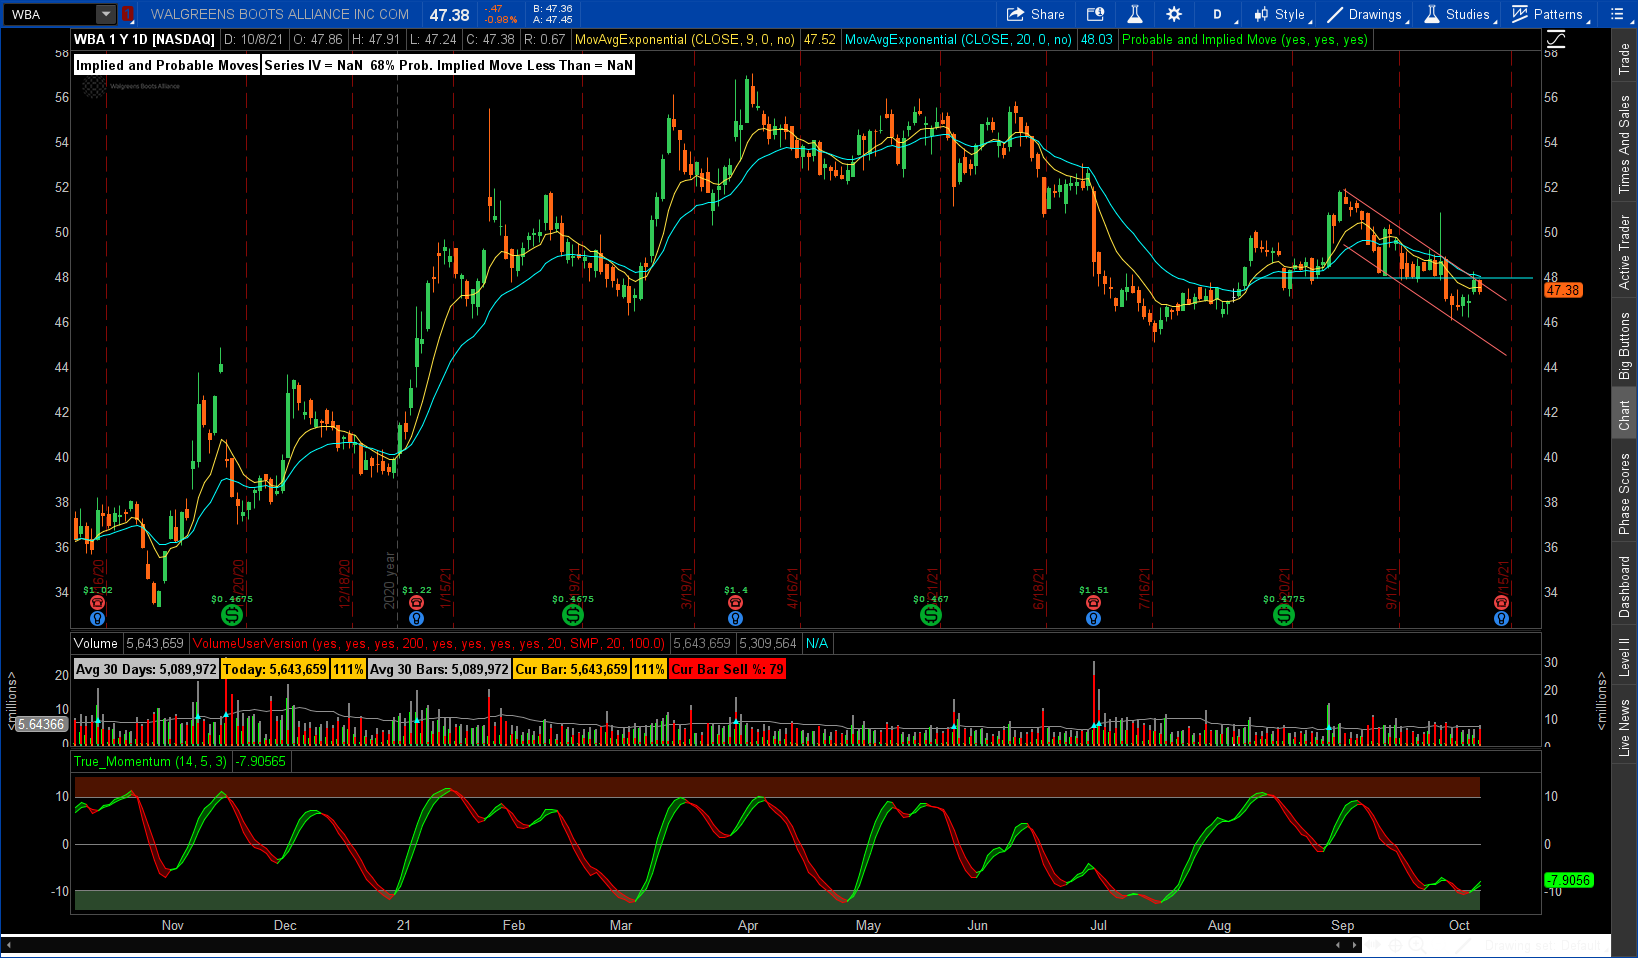
Walgreens Boots Alliance Inc (WBA)
Walgreens is in the drug store business as most of us know. They are engaged in retail pharmacy and wholesale pharmaceuticals both in the US and internationally. Walgreens was founded in 1901 and is headquartered in Deerfield, IL.
WBA has all around decent dividend yield, P/E, and D/E. WBA’s chart has been in a short term down trend for about a month. The price is testing the upper limits of the channel as well as previous resistance. If price can break above the $48 level the stock can see some upside to $52+.
Reality Income (O)
Reality Income is a real estate company which is known for generating dependable monthly dividends. O is the only monthly dividend on our list. O was founded in 1969 and is headquartered in San Diego, CA.
O has a good yield, decent dividend growth, and a terrific D/E. O has a wild P/E ratio, however that is not uncommon for real estate stocks, so I won’t let that concern me too much. O’s chart has a wide upward trending channel that the price has been in for the last year. Last week we saw a good bounce off of the bottom trendline. RSI shows strong upward momentum with moving averages looking promising.
Coca-Cola (KO)
Coca-Cola is a nonalcoholic beverage company with a huge global presence and a large product line. The company was founded in 1886 and is headquartered in Atlanta, GA.
KO has all around decent statistics. The KO chart shows a good week as the price bounced off of a well-supported area that formed toward the beginning of April this year. It is currently in a resistance area that was formed in July. If prices break through we could see potential upside to $56+.
Conclusion
In this article I screened for stocks that look like they will provide regular growing dividends while also having potential for capital gains. My screening criteria found 15 stocks which fit the mold, I then narrowed that list down to 6 based off of the attractiveness of the stock’s chart and my comfort with understanding the company.
I am long on all of the stocks on this list. I already have positions in T, KO, AMGN, and O. I will watch this list play out through the month and will either open new positions or add to current positions at key levels if my capital allows.
I do also take into account what months these stocks pay their dividends and I try to balance my portfolio so that I am earning roughly the same amount of dividends every month. This goal may influence my timing and decisioning when it comes to purchasing some of the stocks on this list.
All 6 stocks are suitable for further research and my article is not to be taken as financial advice. Thank you for reading and feel free to leave any replies or questions you may have on here or on my socials.
Welcome to the first post of Dividend Dollars! Let me start by saying this blog and the strategy that I will develop through it is an experiment. I have no idea how this experiment will end, but I hope that it stumbles into success so that others can follow suit.
Don’t let that word “experiment” scare you. All of investing is an experiment. Every financial security you have ever bought in your life is an experiment and you the scientific method within that experiment even without you trying to. Step one in the scientific method is to question, as trades our question usually is “what stocks can I make money on?” and we begin to research stocks. Step two, we form a hypothesis that originated from that question. We pick stock A over stock B because our hypothesis is that stock A will be more profitable based on our research and ideas. Step three is the actual experiment and testing of the hypothesis which is actually purchasing the stock. The experiment can succeed or it can fail and a good trader completes the scientific method by observing, analyzing, and reporting on the result.
Whether you have recognized this before or not, as traders we are very familiar with experiments. I personally spent 6 years “experimenting”. I went to college in 2016 for a Bachelor’s in Finance and throughout my studies I traded quite casually. After graduating in the summer of 2020, the COVID-19 pandemic had left me unemployed and I found myself with even more time on my hands to experiment. Soon after, I landed a job and started that fall and still traded throughout the day on the job. I have traded for over 5 years and throughout that time I had subscribed to every Twitter furu’s alerts, chatrooms, watchlists, etc. You name it, I did it. And not just with day trading, but I tried all the other popular methods as well like options trading, swing trading, momentum trading, etc. Not only did I try to find success through subscribing to and following the plays of popular traders on the internet, I also amassed a fairly large collection of trading books and have read them all.
“I failed! And that’s ok.”
All of my experimenting, and reading, and formal studies in finance has led me to become a well-educated trader. However, regardless of my knowledge and experience, in my prior 5 years of trading a never found consistent success. My account value started small, I ran into some beginner’s luck and some good plays and had nearly quadrupled my account and every trade since then has been a slow and steady decline to my balance.
I failed! And that’s ok. Here’s why. A study done in 2010 showed that pigeons understand probabilities better than humans. This experiment was ran using the Monty Hall problem which originated from the original host of “Let’s Make a Deal”. The contestants are presented with three doors and only one has a prize. After a contestant makes a guess on which door the prize is behind, Monty Hall would always open one of the remaining doors that did not conceal the prize. The player would then be given the option of staying with their guess or switching to the other door that remained. Most people stayed with their guess despite the fact that switching increased their chances of winner. The contestant is first poised with a choice where they have a 1 in 3 chance of being right. That probability does not change after Monty Hall opens one door, therefore their door remains with the 1/3 chance while the only other door left must now have a 2/3 chance of being right.
The scientists of this study tested six pigeons under the same circumstance. Pigeons were present with 3 small light bulbs. When the bulbs would light up, it indicated that a prize was available. A pigeon would then peck at one of the bulbs and it would turn off showing that it was the wrong choice, the other two bulbs lit up green. The pigeons were then rewarded when they made the right choice with the remaining two bulbs. In this experiment, the pigeons learned the best strategy, 36 percent of them switched answers on day one and 96 percent switched on day two. 12 undergraduate volunteers, however, failed to catch on to the best strategy.
Why am I spewing on about pigeons you may be wondering. Because this is a probability problem. Trading is a probability problem. If we can get outsmarted by pigeons in a Monty Hall experiment, what makes you think we can fare any better in the market where the odd of being profitable are arguably lower than a 2/3 chance of being right? Some traders may argue that you can study fundamentals or technical charting or different set ups to better put the odds of success in your favor. While that argument holds some truth, you also need to realize that every trade is entirely 100% unique. If you were to buy an Amazon stock right now, the current chart set up, price, volume, market conditions, news headlines, company fundamentals and any other stock trait you can think of is wholly unique in this moment and never again will be and never was in the past identical to what it is in this moment. In the Monty Hall experiment, this was not the case, the scenario was the same every time and humans still lost to pigeons!
Correctly predicting and positioning on price movements for consistent and reliable gains in day trading, swing trading, scalping, etc. is extremely difficult. If you can do that, you are smarter than me, most other traders, and the pigeons from the Monty Hall experiment. If you can’t do that, you are in the majority with me. It is due time for me to stop trying predict short to medium term stock movements and instead focus on a strategy where the probabilities aren’t nearly as important.
That is where dividends come in. Dividend Dollars will focus on finding and investing in companies that offer stable and growing dividends while also utilizing some aspects of the trading methods I had experimented with in my last 5 years of trading in order to build towards a portfolio that provides a steady and reliable stream of income while also position the portfolio for capital gains through studying fundamentals, evaluation, and a small amount of technical analysis.